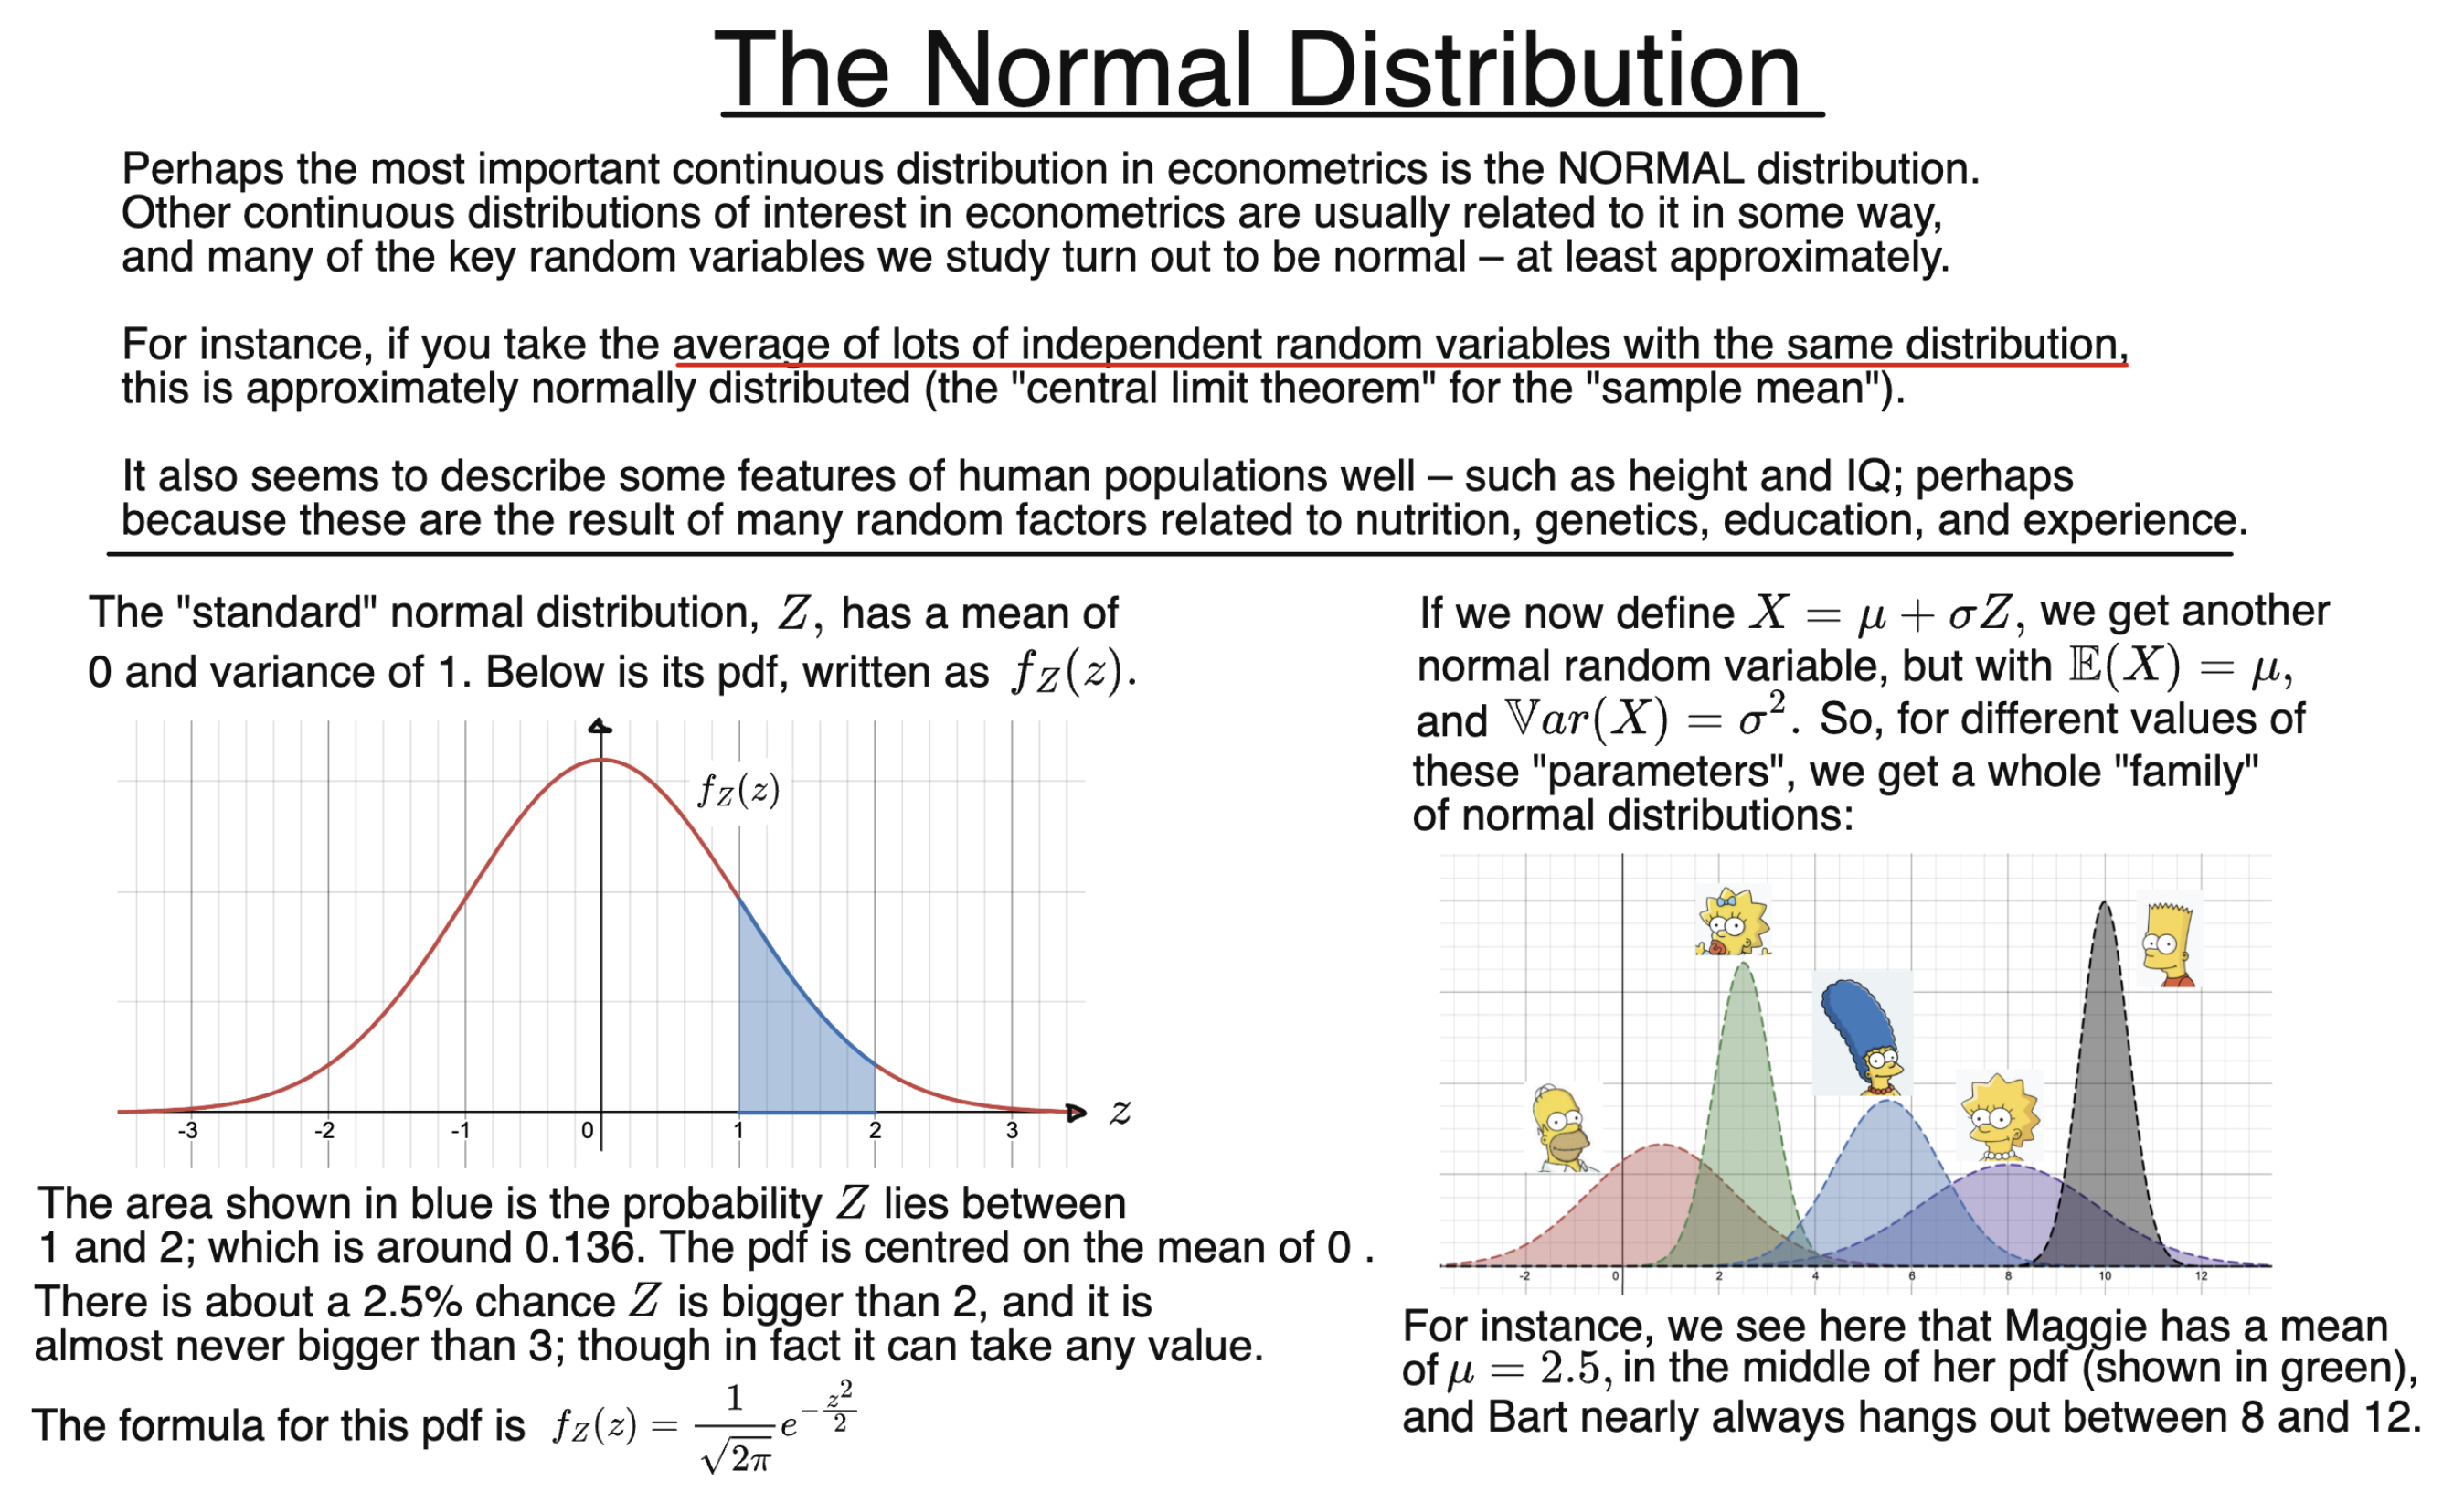
What is a Normal Distribution?
The normal distribution is perhaps the most important distribution in statistics and econometrics.
It is a continuous distribution whose pdf has the familiar, symmetric bell shape, centred around its mean.
A normal distribution has two parameters:
-
$\mu$, the mean, which determines the centre of the distribution: $\mu=\mathbb{E}(X)$
-
$\sigma$, the standard deviation, which determines how spread out the distribution is: $\sigma^2=\operatorname{Var}(X)$
We write
$$X\sim\mathcal{N}(\mu,\sigma^2),$$
where $\sigma>0$.
Because the pdf is symmetric around $\mu$, the median is also equal to $\mu$ – as is the mode, at the highest point.
Increasing $\mu$ shifts the distribution to the right, while decreasing $\mu$ shifts it to the left.
Increasing $\sigma$ makes the distribution more spread out. Since the total area under the pdf must remain $1$, a more spread-out normal pdf is also lower at its centre.
The Normal pdf
The pdf of a normal random variable is
$$f_X(x)=\frac{1}{\sqrt{2\pi}\sigma}e^{-\frac{(x-\mu)^2}{2\sigma^2}}.$$
A normal random variable can in principle take any real value, so its support is
$$x\in\mathbb{R}.$$
As with any continuous random variable, probabilities are given by areas under the pdf.
For example, if we want to find the probability that $X$ lies between two values $c$ and $d$, we calculate
$$\mathbb{P}(c\leq X\leq d)=\int_c^d f_X(x)dx.$$
Unlike the uniform or exponential distributions, this integral generally does not have a simple formula. So, probabilities are usually found using software, a calculator, or statistical tables.
Why the Normal Distribution Matters
Many real-world quantities can be modelled approximately by normal distributions, at least over a useful range. Examples can include characteristics such as human height and some test scores such as IQ.
The normal distribution is also important because averages often have approximately normal distributions.
That is, under suitable conditions, if we average many independent random variables from the same distribution, the distribution of the average becomes approximately normal as the sample size grows.
This is the central limit theorem, one of the most important results in probability and statistics.
If the variables being averaged are themselves exactly normally distributed, then their average is exactly normally distributed too.
The Standard Normal Distribution
A particularly important normal distribution has
$$\mu=0$$
and
$$\sigma=1.$$
This is called the standard normal distribution.
We usually write
$$Z\sim\mathcal{N}(0,1).$$
Its pdf is
$$f_Z(z)=\frac{1}{\sqrt{2\pi}}e^{-z^2/2}.$$
The standard normal distribution is centred at $0$ and has variance $1$.
For example,
$$\mathbb{P}(1\leq Z\leq2)\approx0.136.$$
The standard normal distribution is especially useful because any normal random variable can be transformed into a standard normal random variable. This idea is explored separately when we look at standardising normal distributions. We can then find probabilities for the standard normal distribution using a statistical table.
Explore the Normal pdf and Calculate Probabilities
In the interactive graph below, $\mu$ determines the centre of the normal distribution and $\sigma$ determines its spread.
You can also choose two values, $c$ and $d$, to calculate
$$\mathbb{P}(c\leq X\leq d).$$
The shaded region shows this probability as an area under the pdf.
Try changing:
-
$\mu$, the mean of the distribution;
-
$\sigma$, the standard deviation;
-
$c$ and $d$, the endpoints of the interval whose probability you want to find.
Notice how changing $\mu$ shifts the distribution without changing its shape, while changing $\sigma$ changes its spread.
Normal Distribution Summary
| Notation: | $X\sim\mathcal{N}(\mu,\sigma^2)$ |
| Type: | Continuous |
| Parameters: | $\mu$ = mean, $\sigma>0$ = standard deviation |
| pdf: | $f_X(x)=\frac{1}{\sqrt{2\pi}\sigma}e^{-\frac{(x-\mu)^2}{2\sigma^2}}$ |
| Support: | $x\in\mathbb{R}$ |
| Mean: | $\mathbb{E}(X)=\mu$ |
| Variance: | $\operatorname{Var}(X)=\sigma^2$ |
| Standard normal: | $Z\sim\mathcal{N}(0,1)$ |
Background:
Extensions:
Understanding Econometrics is completely free to use, and always will be.
If you found the site useful and would like to help me keep adding new material, please consider buying me a coffee! Buy me a coffee ☕