What is a Probability Density Function?
A probability density function, or pdf, is a function whose area over any range gives the probability that a continuous random variable lies within that range.
We write the pdf of a continuous random variable $X$ as $f_X(x)$. For any two values $a$ and $b$ with $a \leq b$,
$$\mathbb{P}(a \le X \le b)=\int_a^b f_X(x),dx.$$
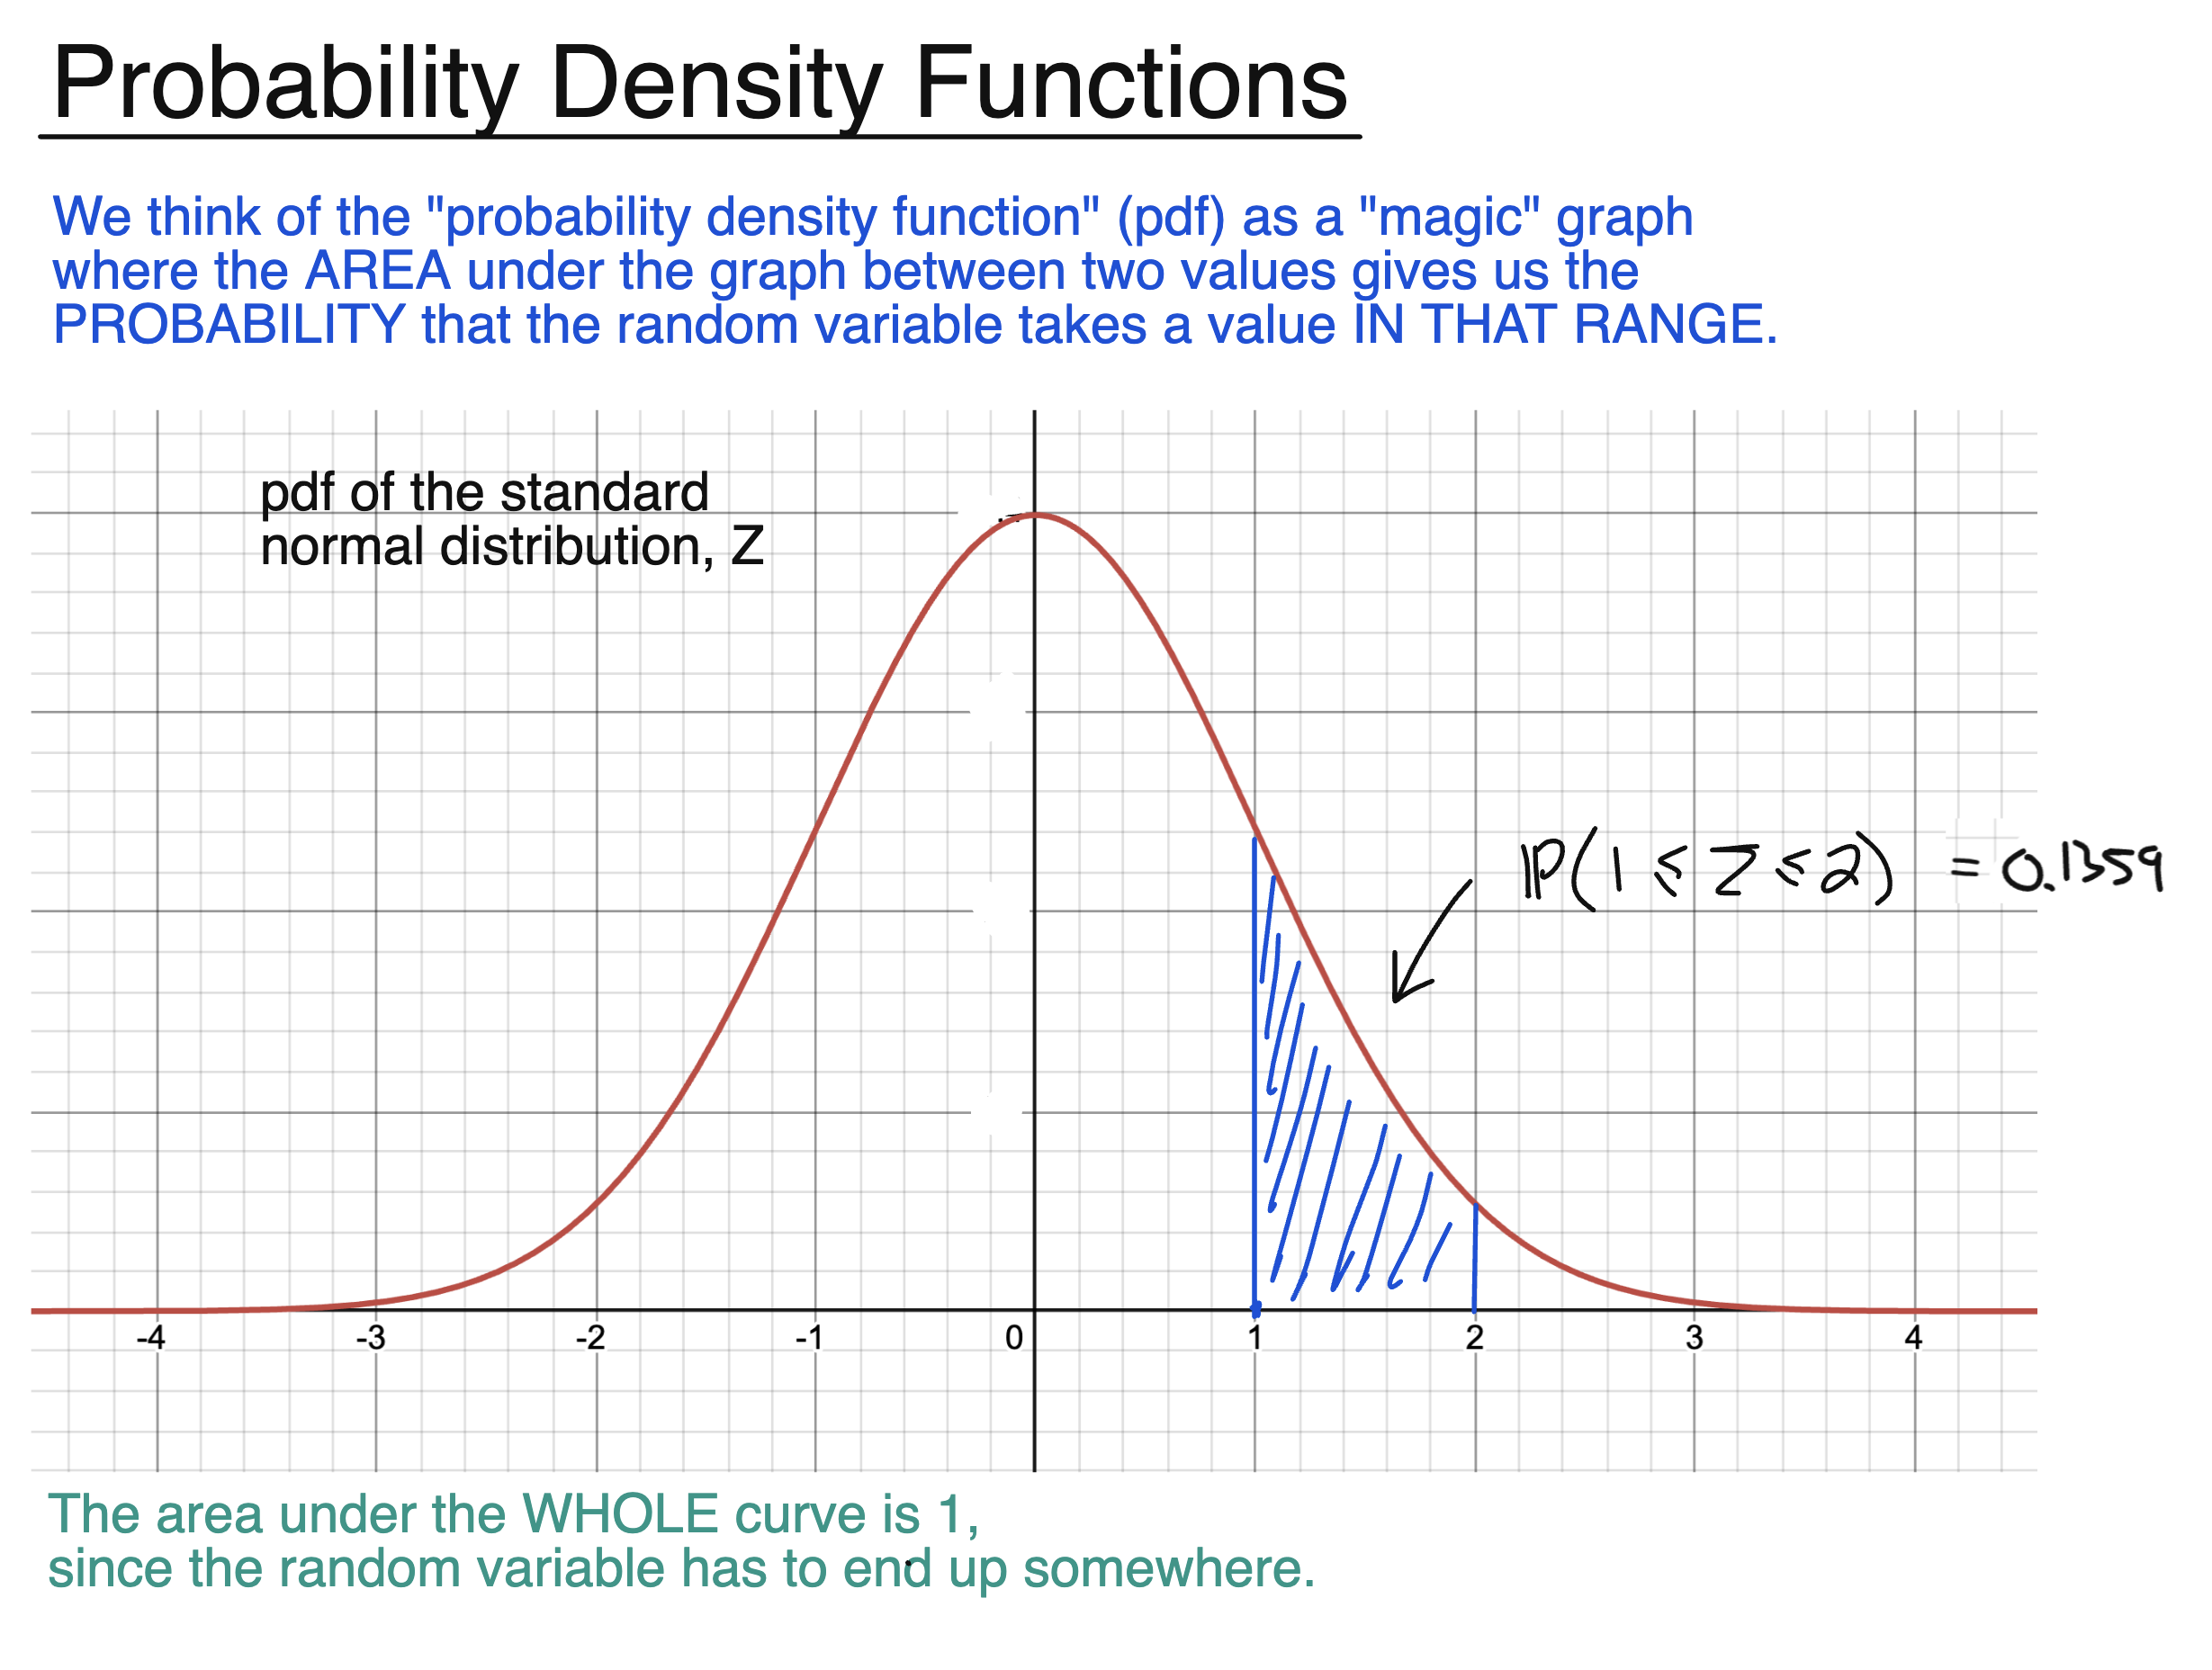
For example, the slide shows the pdf of a standard normal random variable $Z$. The area under the curve between 1 and 2 is about 0.1359, so
$$\mathbb{P}(1\le Z\le 2)\approx 0.1359.$$
The important word here is area. The height $f_X(x)$ of the pdf at a particular point is not itself the probability that $X=x$. Indeed, for a continuous random variable,
$$\mathbb{P}(X=x)=0.$$
A taller part of the pdf instead tells us that values around that point are more likely to occur than values around a lower part of the curve.
A pdf must always be non-negative:
$$f_X(x)\geq 0.$$
Its total area must also equal 1:
$$\int_{-\infty}^{\infty} f_X(x),dx=1.$$
This reflects the fact that the random variable has to end up somewhere. Notice that the height of a pdf does not itself have to be less than 1, since it is the area underneath the curve that represents probability.
Later, we will also use probability density functions to find features of continuous random variables such as their expected values.
Background:
See also:
Understanding Econometrics is completely free to use, and always will be.
If you found the site useful and would like to help me keep adding new material, please consider buying me a coffee! Buy me a coffee ☕