From a Model to Data
Suppose we believe that two variables are related according to the linear model
$$Y=\beta_0+\beta_1X+U.$$
Our main problem, we recall, is that we do not know the values of the coefficients $\beta_0$ and $\beta_1.$
To learn about these, we should first collect some data.
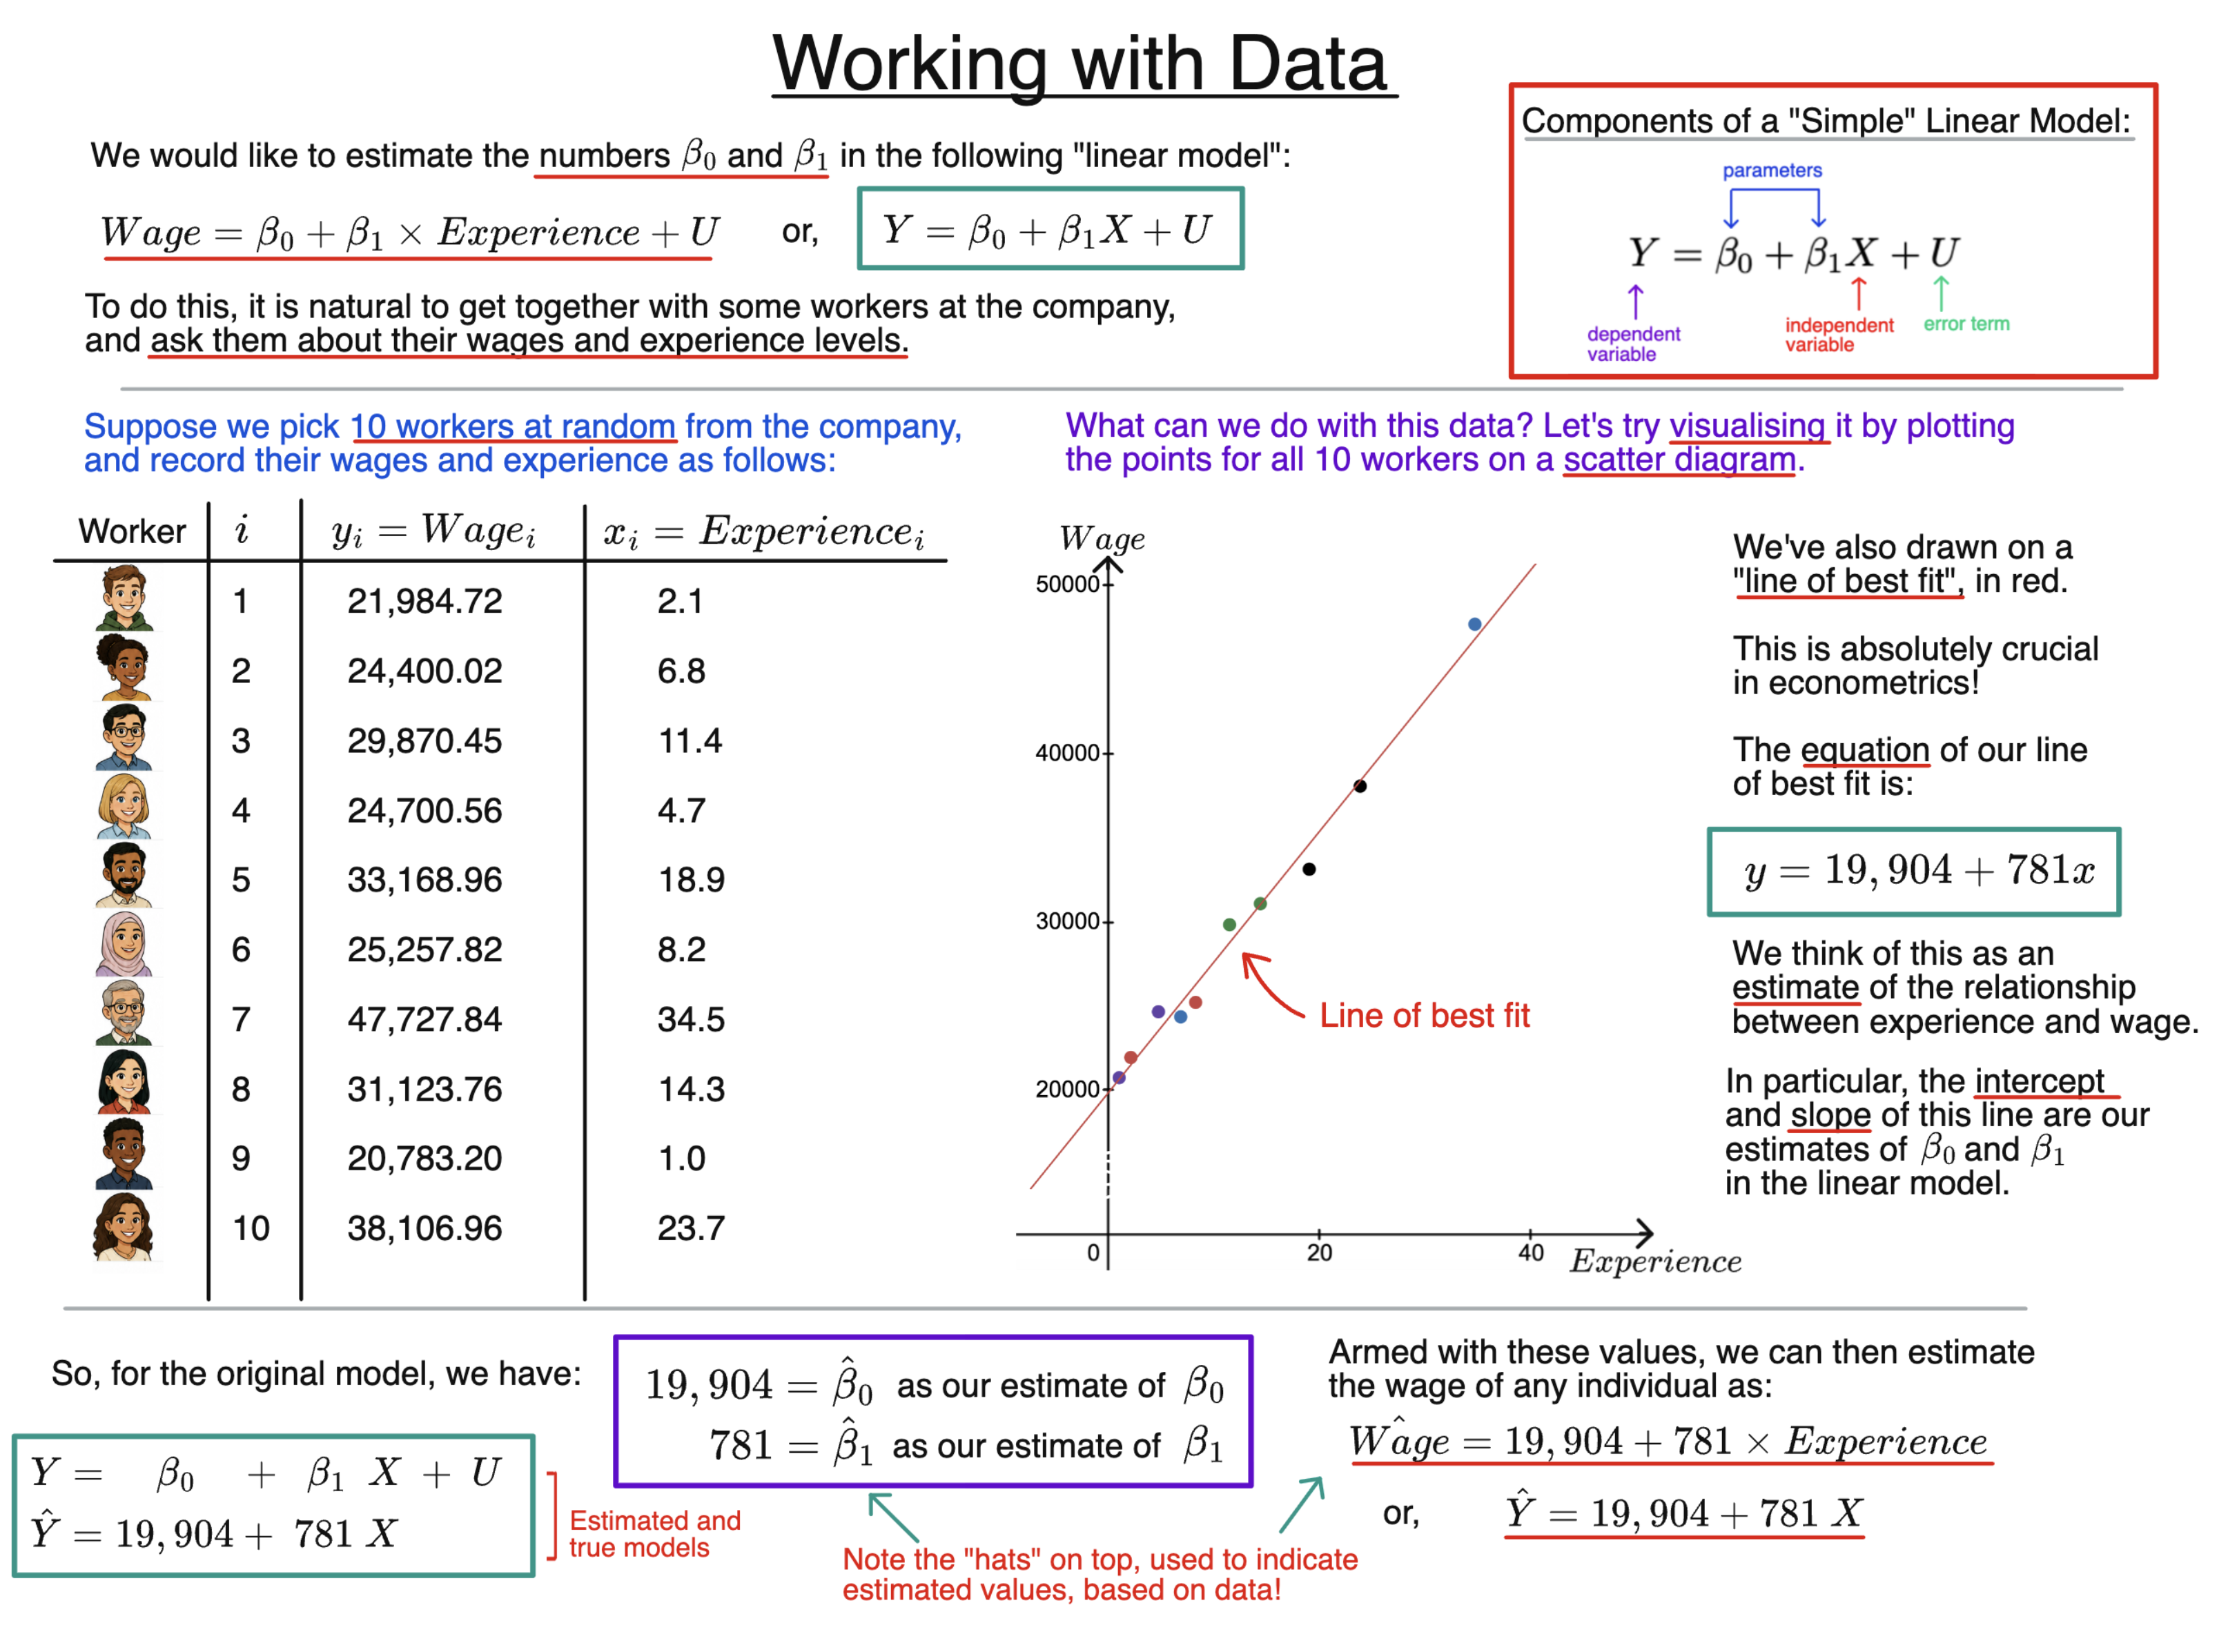
Suppose we take a sample of $n$ individuals. For each individual $i$, where $i=1,\ldots,n$, we observe a value $y_i$ of the dependent variable and a value $x_i$ of the independent variable.
In the example in the slide, $Y$ is wage and $X$ is experience. Each worker in our sample therefore gives us one pair of observations, $(y_i,x_i).$
Plotting the Data
A useful first step is to plot these observations on a scatter diagram.
Each point represents one individual in the sample. Its horizontal position gives $x_i$, while its vertical position gives $y_i.$
If the points display something resembling a linear relationship, we can try to summarise that relationship using a line of best fit.
For the data in the slide, this line is
$$y=19{,}904+781x.$$
The line does not pass through every observation. Instead, it gives us a single linear relationship intended to fit the collection of points on the graph as well as possible. Hence the name: line of best fit.
Estimating the Model
Now for the crucial idea. This simple trick underlies nearly all of econometrics!
It is that we can use the intercept and slope of this fitted line as estimates of the unknown coefficients in our original model.
That is, comparing our model
$$Y=\beta_0+\beta_1X+U.$$
with our line of best fit
$$y=19{,}904+781x,$$
we make the estimates
$$\hat\beta_0=19{,}904$$
and
$$\hat\beta_1=781.$$
Notice again the hats: the original coefficients $\beta_0$ and $\beta_1$ are fixed but unknown features of the original setup. In contrast, the quantities $\hat\beta_0$ and $\hat\beta_1$ are the estimates we have just constructed from the sample data.
We then write the “estimated model” as follows:
$$\hat Y=19{,}904+781X.$$
Armed with this equation, we can also predict values of $Y$ for other values of $X.$
Background
Understanding Econometrics is completely free to use, and always will be.
If you found the site useful and would like to help me keep adding new material, please consider buying me a coffee! Buy me a coffee ☕