What Is Sampling From a Population?
Sampling from a population means selecting individuals from a population and collecting information about them, so that we can learn about features of the population as a whole.
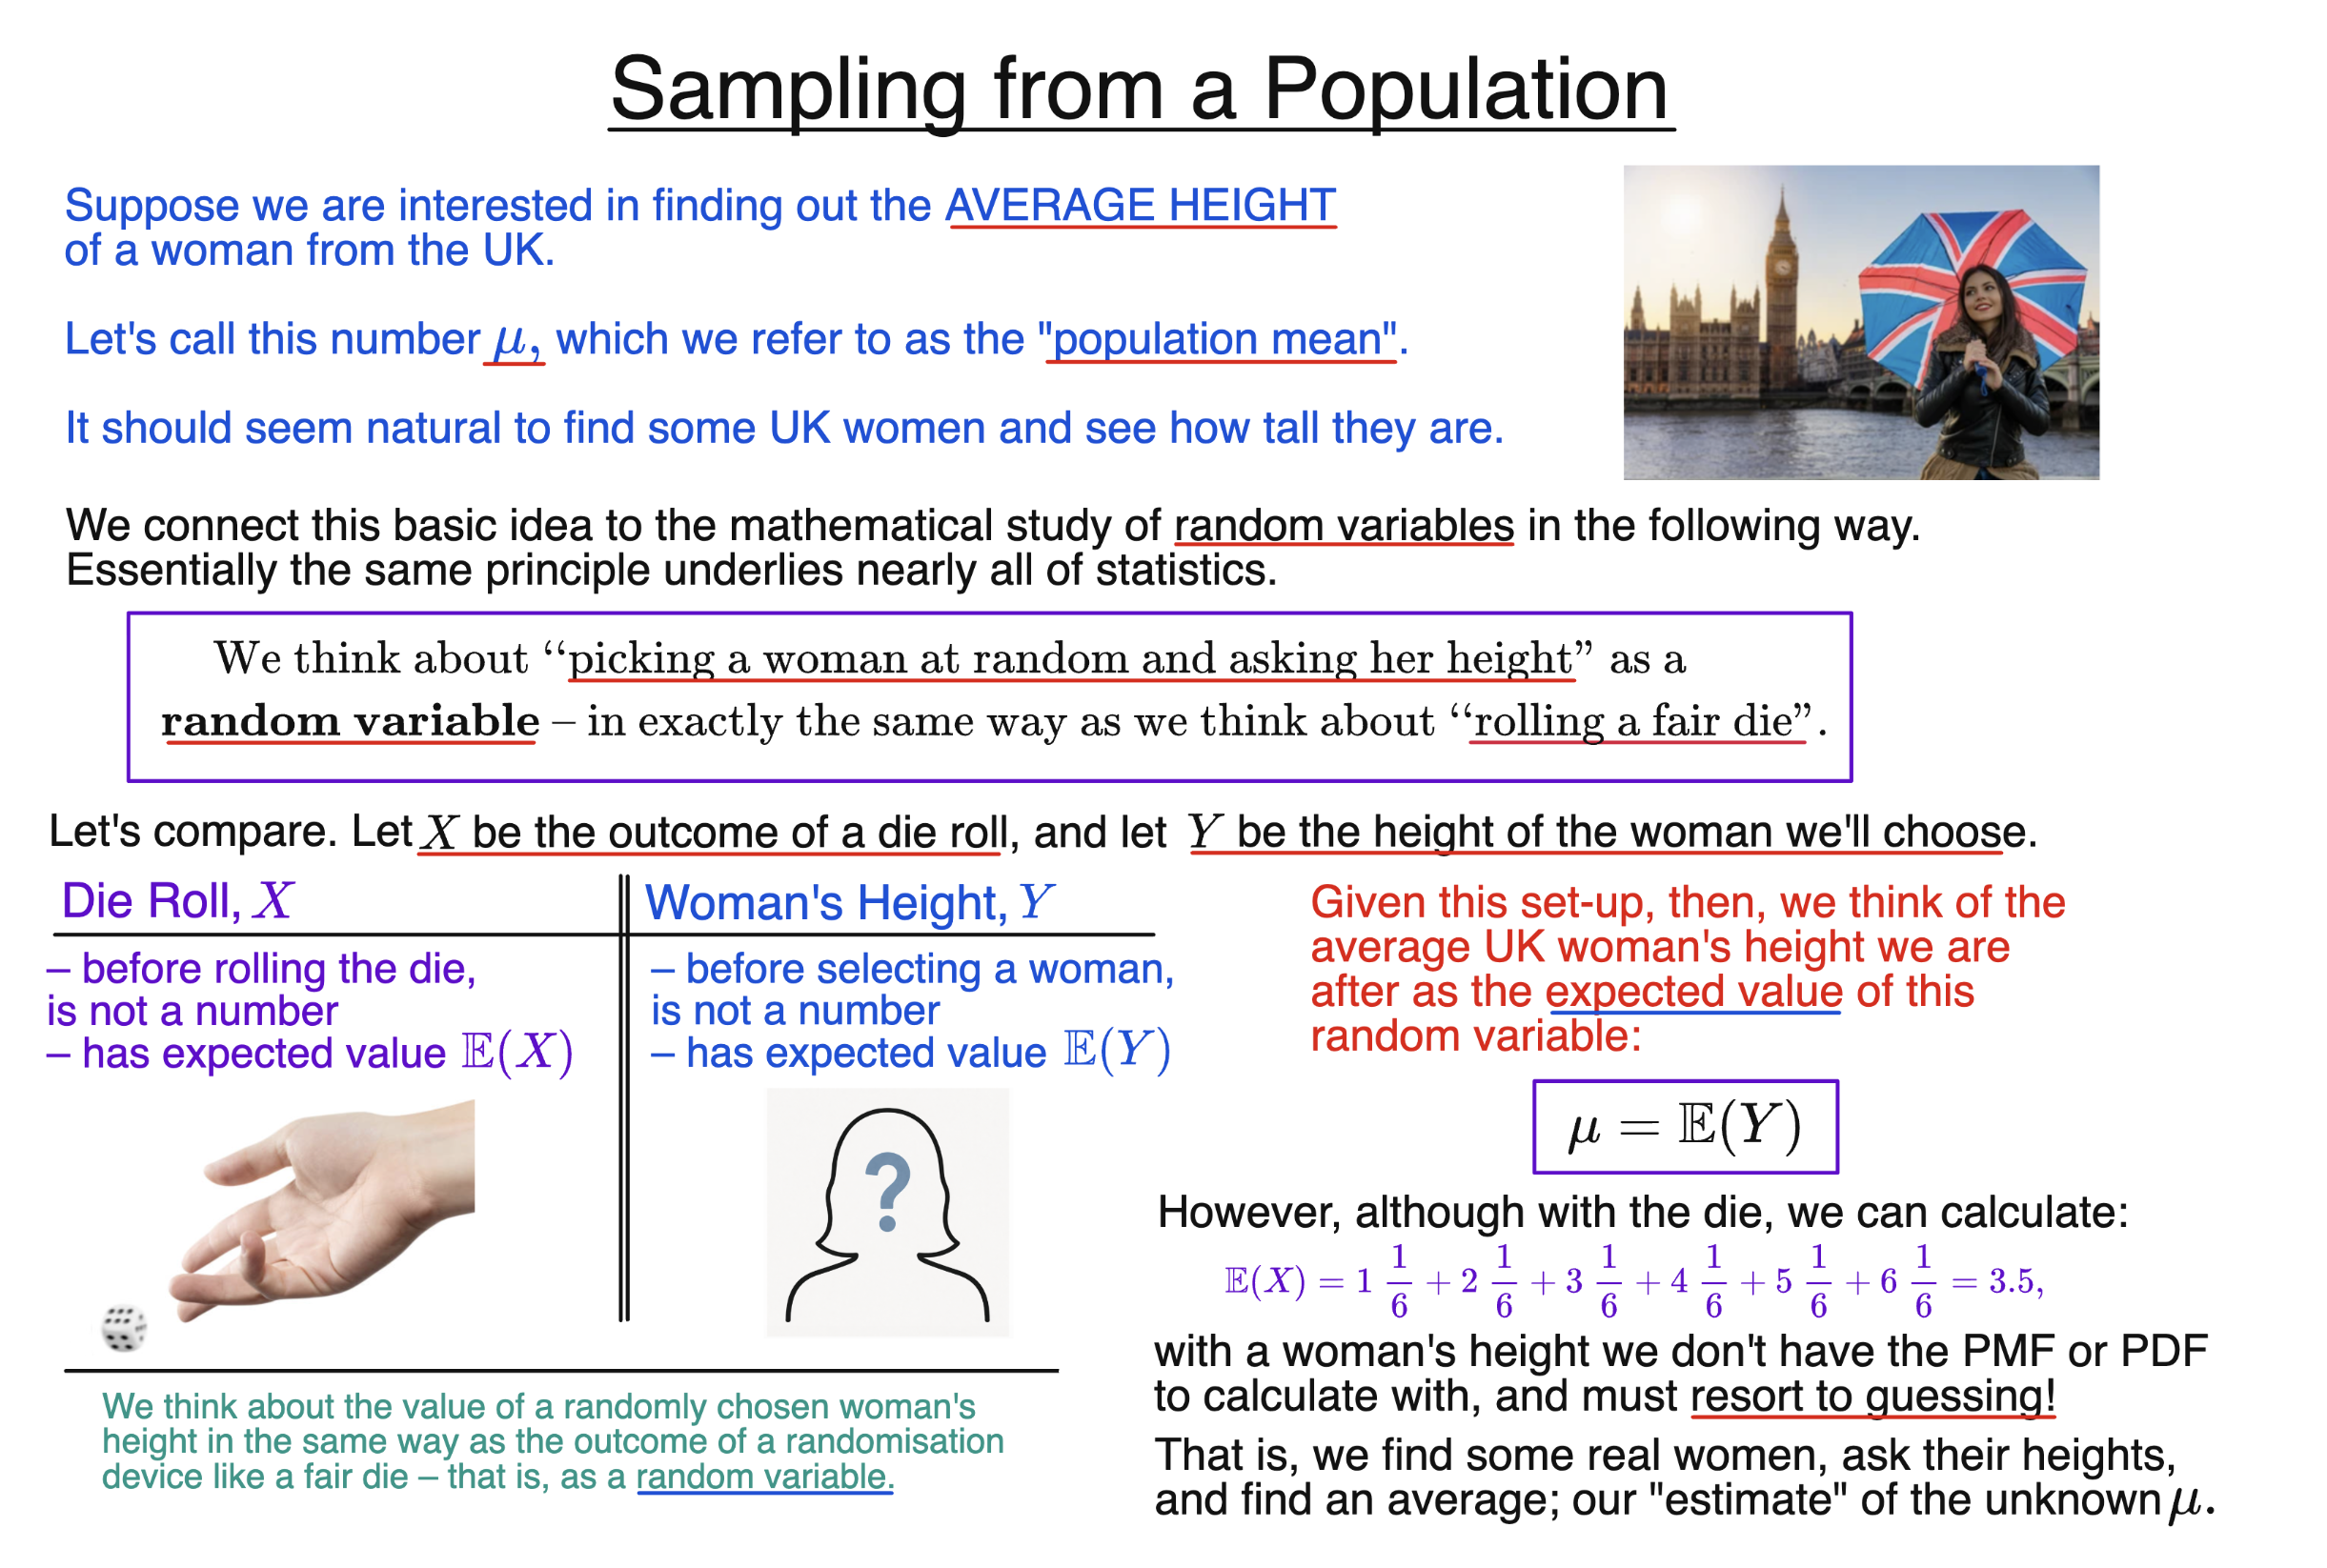
Suppose, for instance, that we want to know the average height of a woman in the UK. We call this unknown number the population mean, and denote it by $\mu$.
It seems natural that, to find out about $\mu$, we should start by selecting some women from the UK and asking how tall they are.
A fundamental principle of statistics is to understand this process using the theory of random variables.
Sampling as a Random Experiment
Imagine planning to select one woman at random from the UK population and recording her height.
Before we have selected her, we do not know what her height will be. Depending on the population, there are a number of possible values — one of which will be observed when the woman is chosen at random. So, conceptually, this is just like rolling a die!
Noting this similarity, we can represent the height of the woman we are going to select by a random variable, which we will call $Y$.
If $X$ represents the outcome of a die roll, then before rolling the die we do not know what value $X$ will take. Likewise, before selecting a woman, we do not know what value $Y$ will take. The difference is simply what the experiment consists of: for $X$, we roll a die; for $Y$, we select a woman at random and record her height. In both cases, we perform a random “experiment” and obtain a numerical result.
This simple idea — that selecting an individual from a population is like rolling a die, and that the quantity we record can therefore be treated as a random variable — underlies much of statistics!
The Population Mean as an Expected Value
Now suppose there are $n$ women in our UK population, with heights
$$h_1,h_2,\dots,h_n.$$
If each woman is equally likely to be selected, then each indexed height $h_i$ enters our calculation with probability $1/n$.
The expected value of $Y$ is therefore
$$\mathbb{E}(Y)=h_1\frac{1}{n}+h_2\frac{1}{n}+\dots+h_n\frac{1}{n}=\frac{h_1+h_2+\dots+h_n}{n}.$$
But the expression on the right is precisely the average height of the population — exactly what we wanted to know at the beginning!
So, for the population average height $\mu$, we may write
$$\mu=\mathbb{E}(Y).$$
We understand this in the same way as writing
$$3.5=\mathbb{E}(X)$$
for the fair die roll, except that in the case of the heights, $\mu$ is unknown.
This is one of the basic moves in statistics: we represent a feature of a population we are interested in, such as average height, using a population random variable whose value is what we would observe if we randomly selected an individual and recorded that feature.
Why Do We Need Statistics?
For a fair die, we know the distribution of $X$, so we can calculate
$$\mathbb{E}(X)=1\times\frac{1}{6}+2\times\frac{1}{6}+3\times\frac{1}{6}+4\times\frac{1}{6}+5\times\frac{1}{6}+6\times\frac{1}{6}=3.5.$$
In principle, we could also calculate $\mathbb{E}(Y)$ directly if we already knew the heights of every woman in the UK population. But of course, that is exactly the information we do not have!
More generally, calculating an expected value using probability theory generally requires a lot of information about the distribution of $Y$ – usually, either its full pdf or pmf. For a real-world population, finding this information may be considerably harder than finding $\mathbb{E}(Y)$ directly.
So, in statistics, instead of calculating quantities like
$$\mu=\mathbb{E}(Y),$$
we resort to estimation — or, less grandly, clever guessing.
For our example, we will collect some data on women’s heights and use these data to estimate the unknown population mean $\mu$.
Modelling and the Real World
We may notice a limitation in the analogy we have drawn so far between investigations of populations in the real world and the theory of random variables.
For instance, a real population consists of actual people, and it changes over time. Our “population random variable” $Y$, by contrast, is treated as having a fixed probability distribution, and its expected value $\mu$ is therefore treated as fixed.
Such a mismatch is somewhat inevitable, since statistics must translate the messy real world into a pristine mathematical probability model. The best we can hope for is that the model captures the features that matter for the question we are asking.
Questions of this sort belong to the art of mathematical modelling more generally: representing a complicated real process using a much simpler formal object. To paraphrase George Box: all models are imperfect, but some are useful!
Background
Understanding Econometrics is completely free to use, and always will be.
If you found the site useful and would like to help me keep adding new material, please consider buying me a coffee! Buy me a coffee ☕