How Do We Find the “Line of Best Fit”?
So far, we have talked rather casually about drawing a line of best fit through our data.
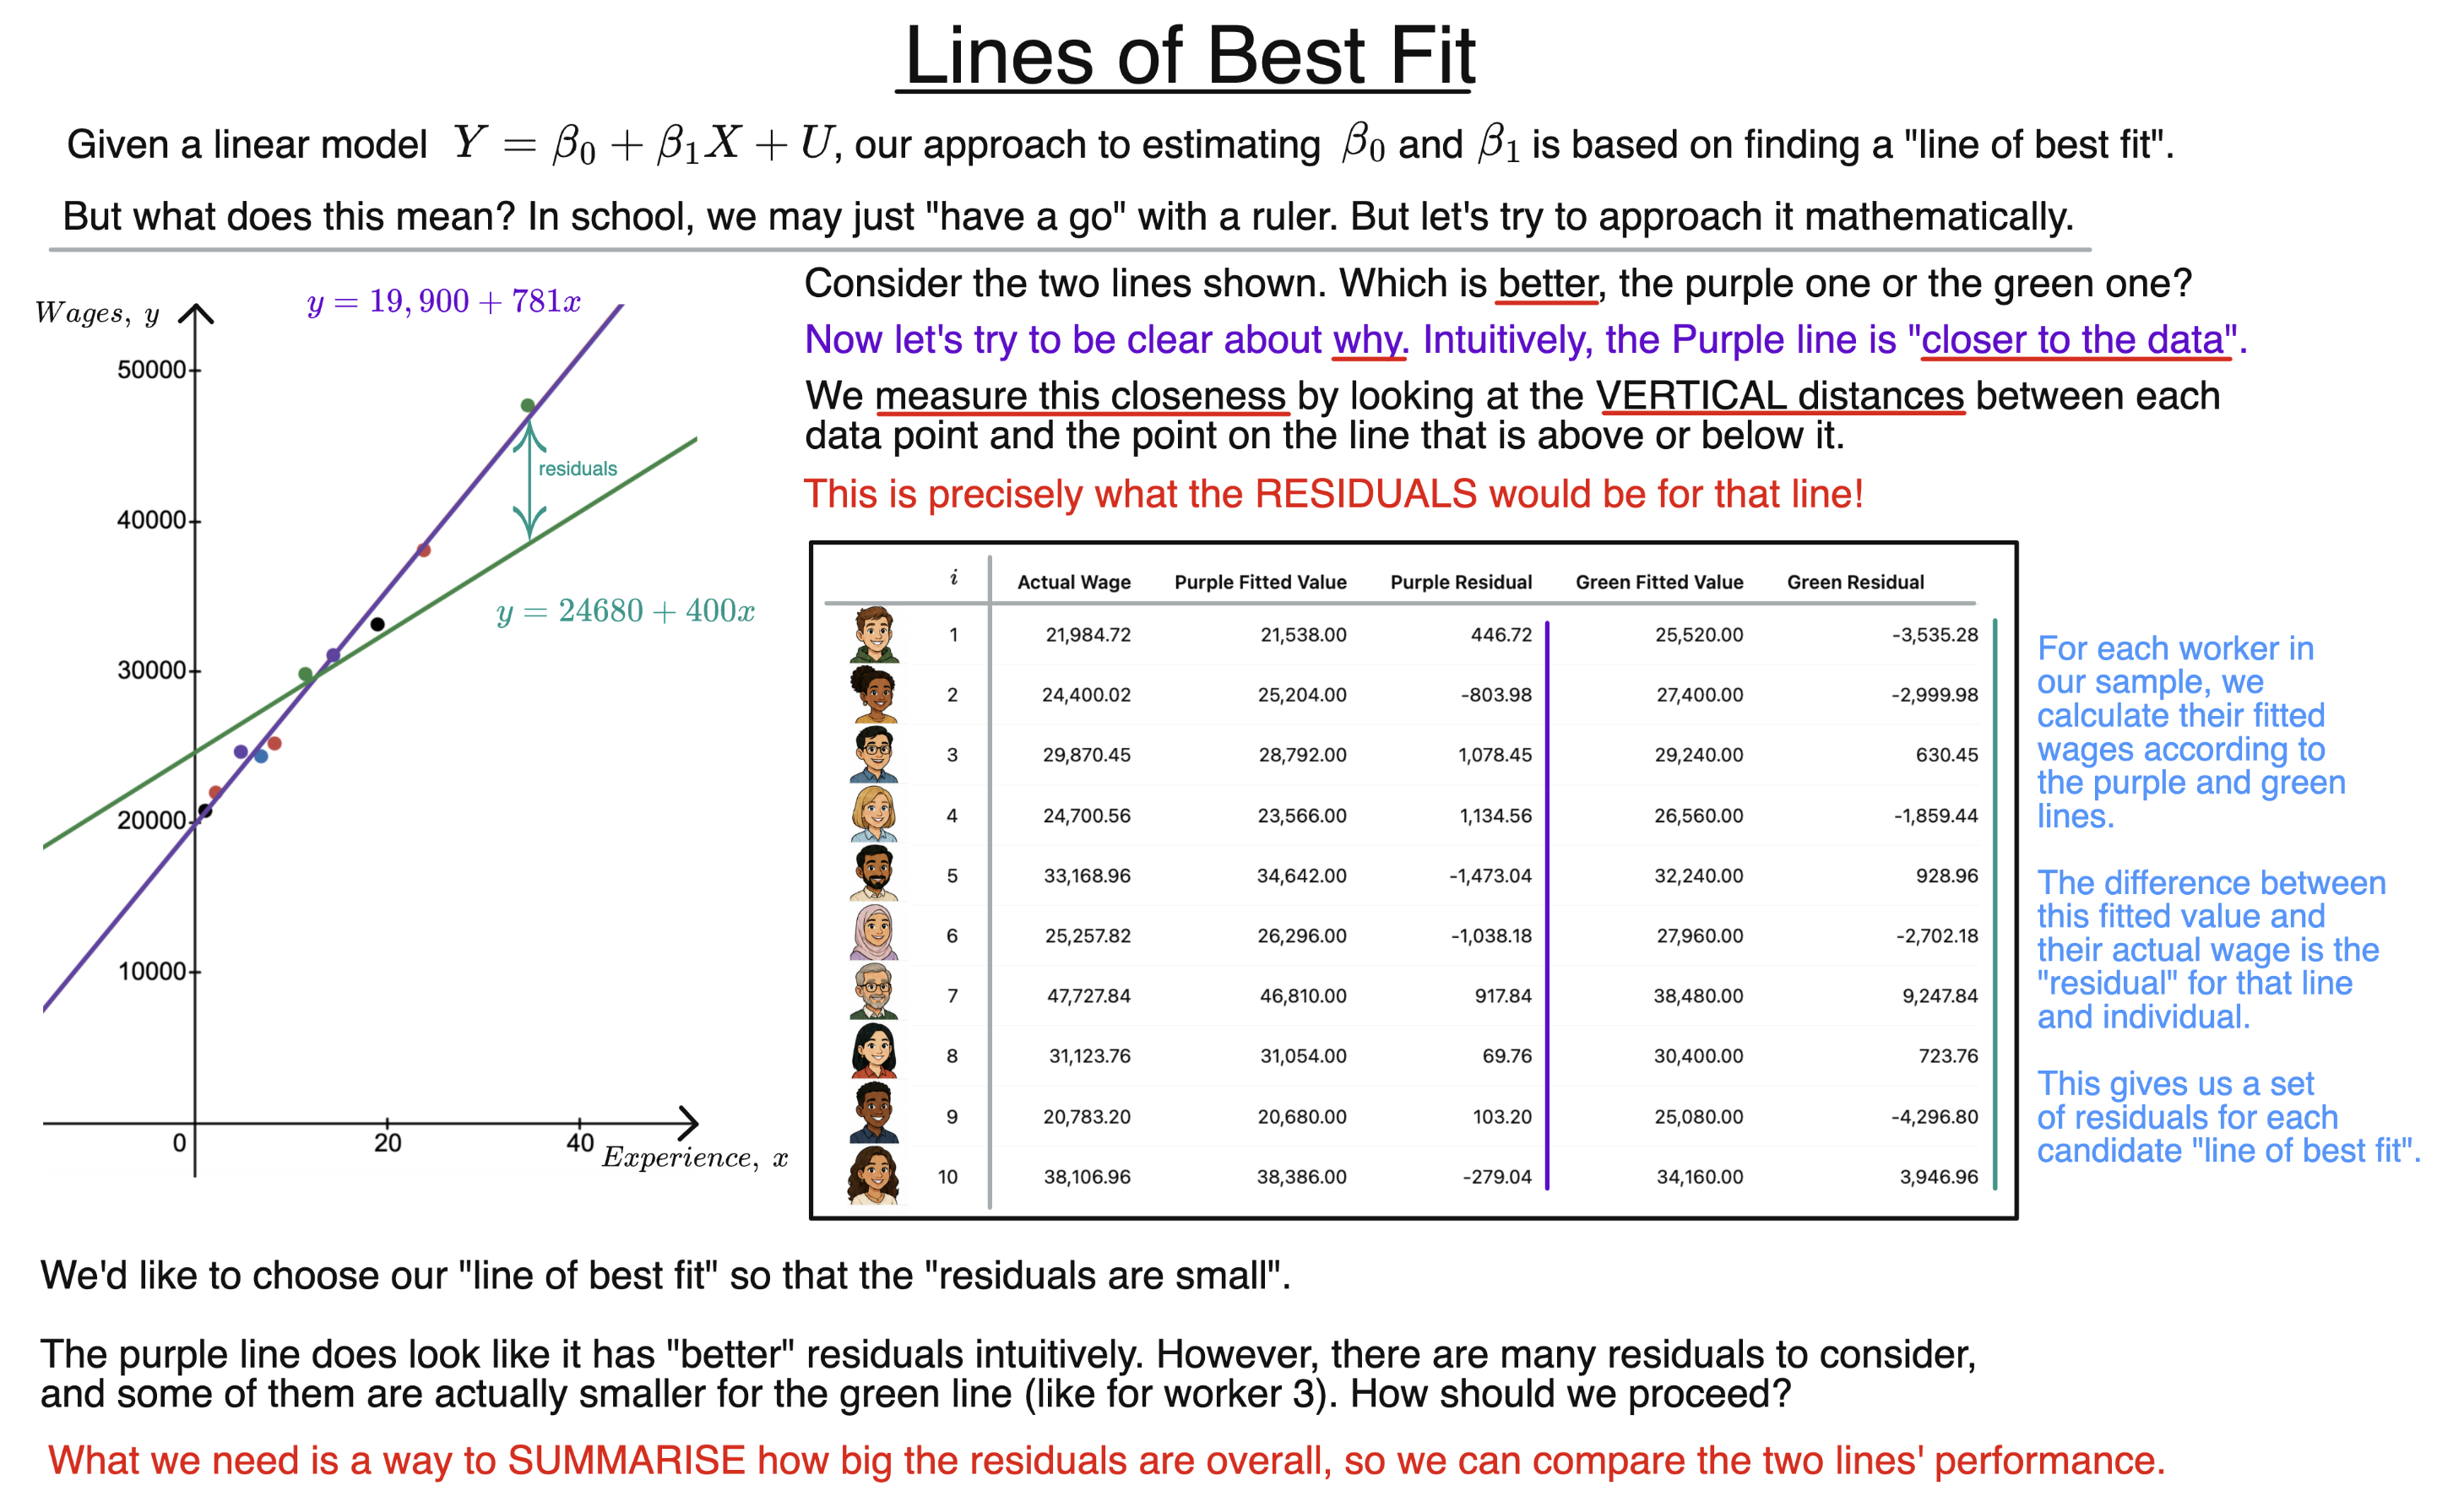
At first, this may seem straightforward. Given the two candidate lines in the slide, for instance, the purple line appears to fit the points much better than the green one. You may have distant memories of a teacher at school asking you to draw on a line of best fit, and just “going for it” by eye. If you were very careful, you may have used a ruler too!
However, we are now going to be much more sophisticated. If linear regression is to be a mathematical method that we can rigorously investigate, we need to make the idea of “best fit” more precise.
Comparing Candidate Lines
We recall that if we substitute $x_i$ into our line of best fit, we get the “fitted value”:
$$\hat y_i=\hat\beta_0+\hat\beta_1x_i.$$
So, each candidate line gives us a fitted value for every individual in our sample.
For individual $i$, we can then compare this fitted value with the actual observed value $y_i.$ The difference between them may be called the residual for that candidate line:
$$\hat u_i=y_i-\hat y_i=y_i-(\hat\beta_0+\hat\beta_1x_i).$$
Geometrically, these residuals are the vertical “differences” between the datapoints and the line, allowing for negative values when points are below the line.
We’d like a good line to be “close to the data”, and we evaluate this precisely by looking at these residuals. That is, if a line fits the data well, it should have residuals that are, in some overall sense, “small”.
Measuring Fit Overall
The table in the slide shows the residuals produced by our two candidate lines.
Some residuals are positive and some are negative, and the size of the residual varies from one observation to another. Although the green ones seem bigger overall, for some observations the green residual is actually smaller (see if you can find one).
In particular, looking at any single residual will not tell us which line fits the whole dataset better.
What we need is a way to combine all of the residuals into a single measure of how well a candidate line fits the data overall.
Once we have such a measure, we can compare different lines mathematically, and try to seek out the one that deserves to be called our line of best fit.
Background
Understanding Econometrics is completely free to use, and always will be.
If you found the site useful and would like to help me keep adding new material, please consider buying me a coffee! Buy me a coffee ☕