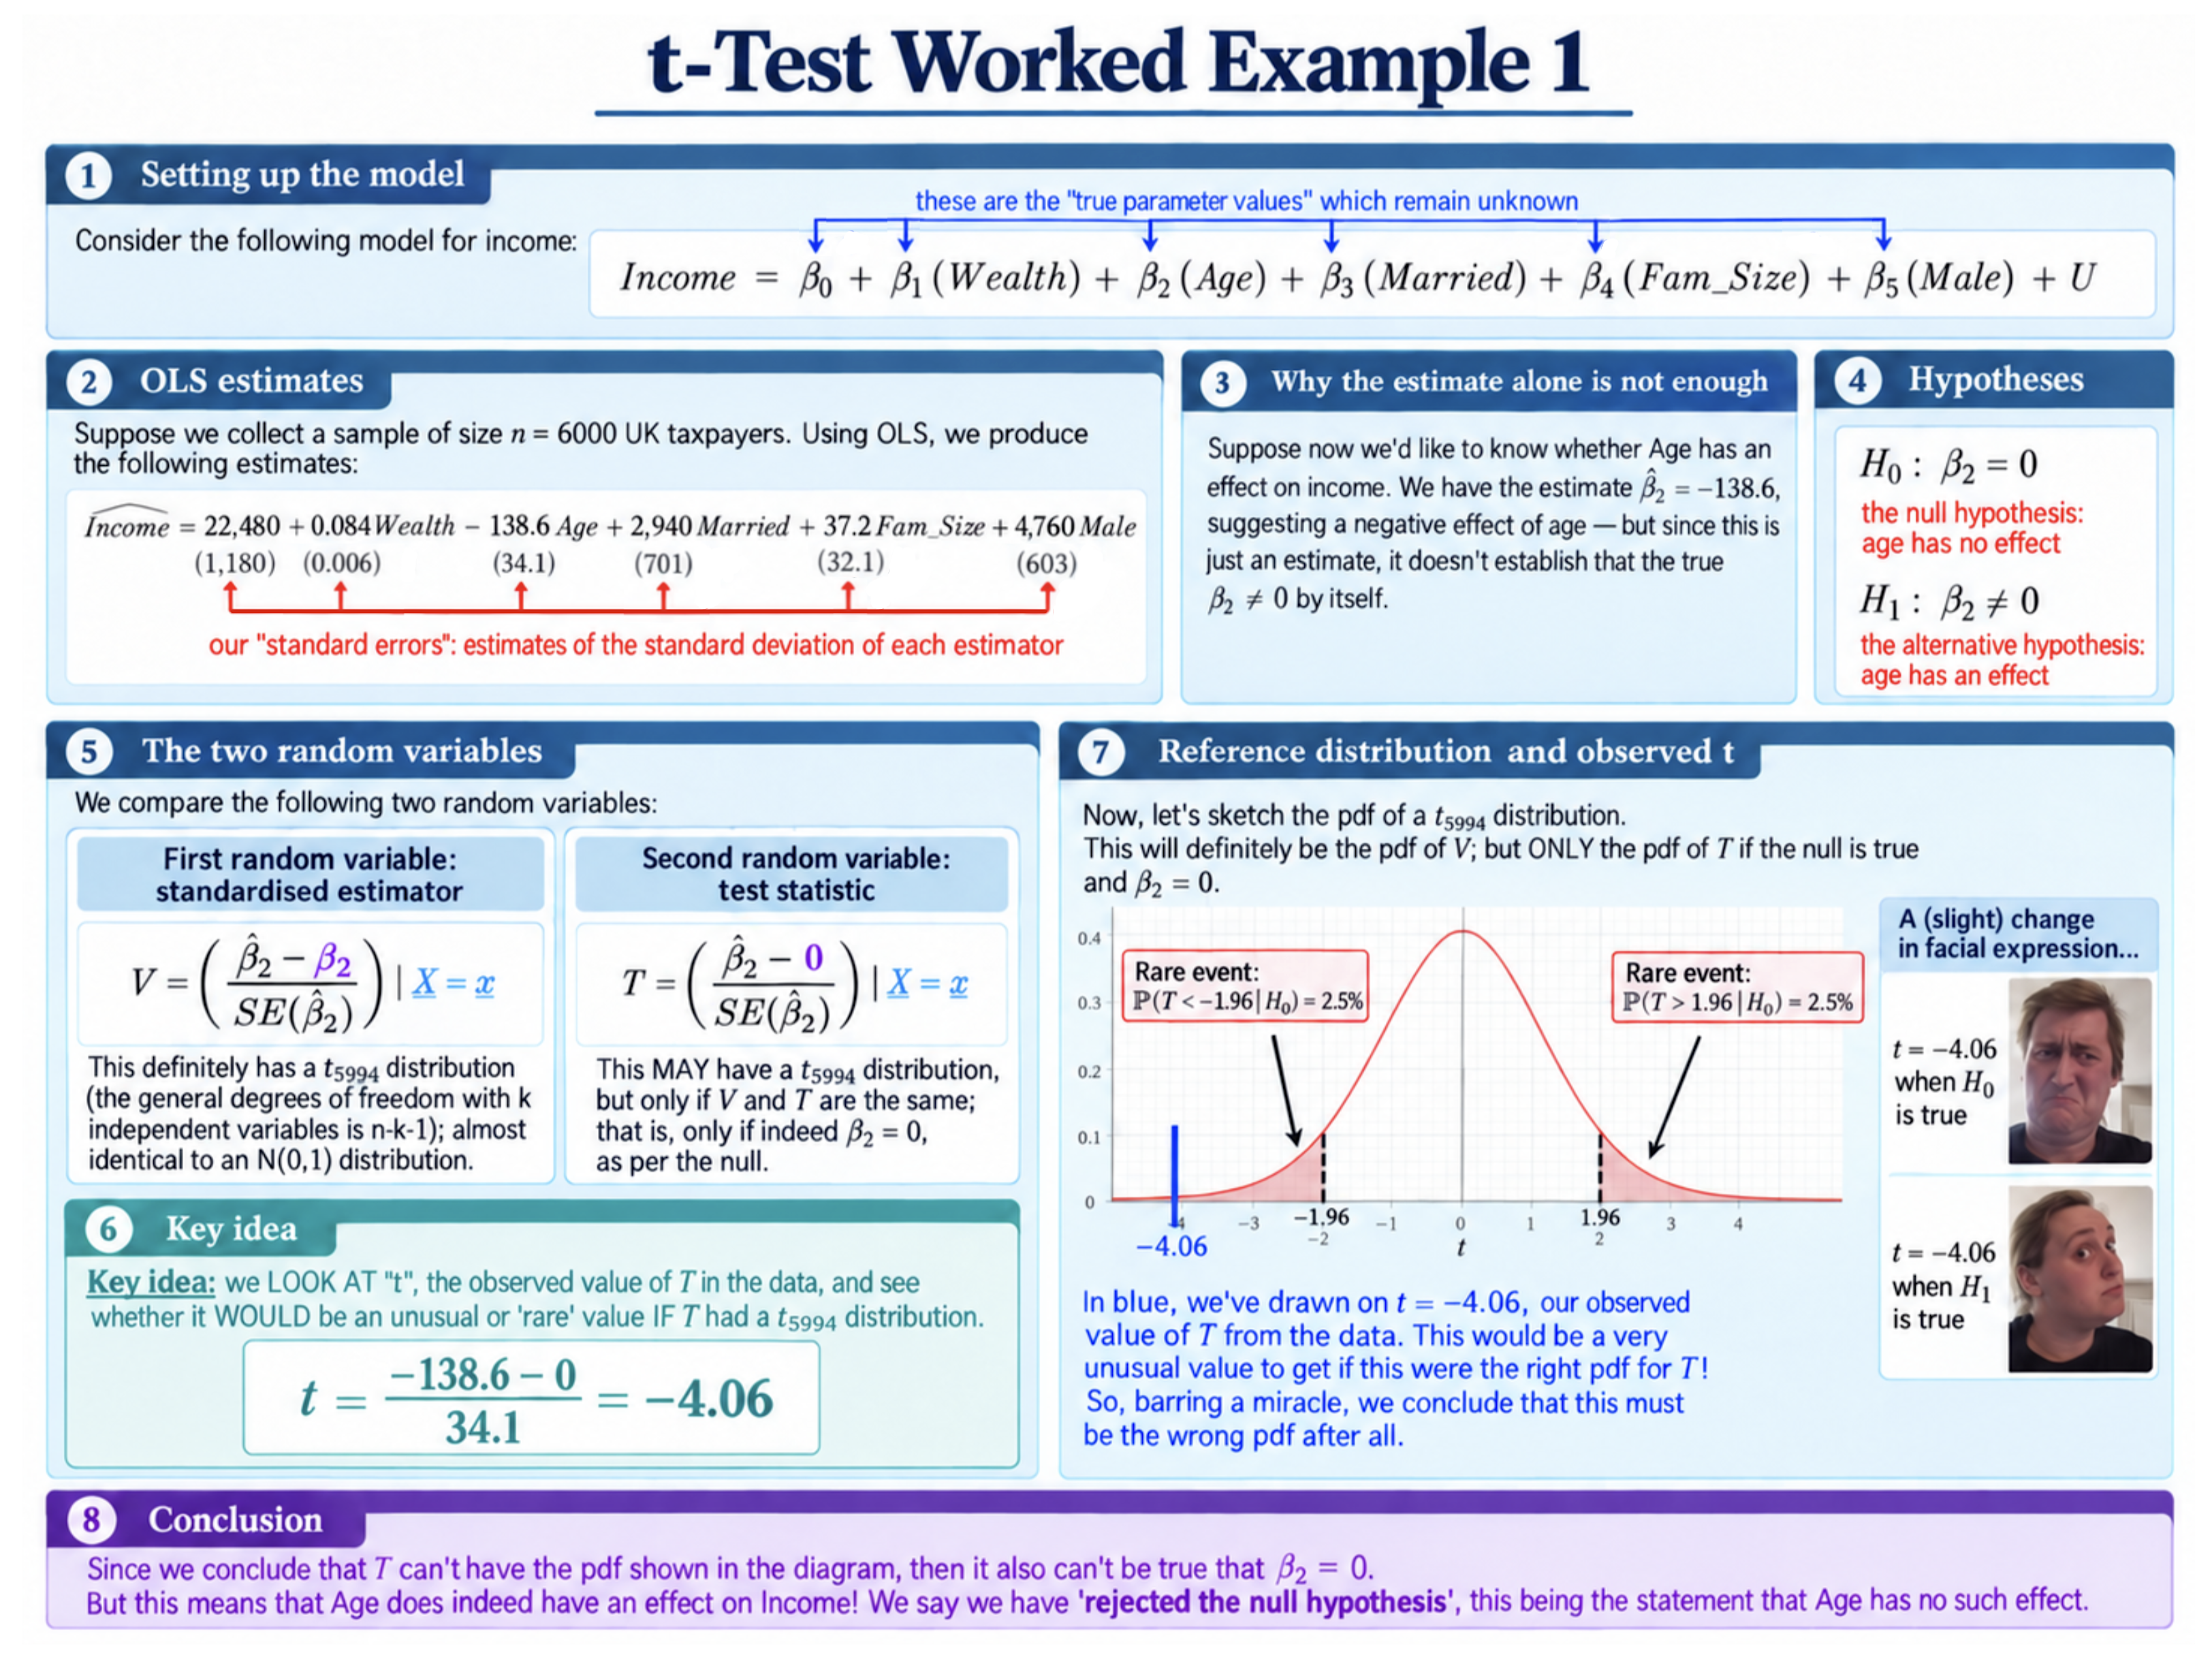
A Worked $t$-test
Let’s now put our $t$-test into practice.
Suppose we are interested in the following population model for income:
$$Income=\beta_0+\beta_1Wealth+\beta_2Age+\beta_3Married+\beta_4Fam_Size+\beta_5Male+U$$
In particular, we would like to know whether $Age$ has an effect on $Income$; that is, whether $\beta_2\neq0$.
We collect a sample of
$$n=6000$$
UK taxpayers and estimate the model using OLS.
Our estimated model is
$$\widehat{Income}=22,480+0.084Wealth-138.6Age+2,940Married+37.2Fam_Size+4,760Male$$
Let’s focus on the coefficient on $Age$:
$$\hat\beta_2=-138.6$$
The negative estimate suggests that, holding the other variables fixed, income decreases with age.
But, as we have emphasised, $\hat\beta_2$ is only an estimate. The fact that it is negative does not by itself establish that the true coefficient $\beta_2$ is different from zero in reality.
Suppose further that we calculate its standard error:
$$SE(\hat\beta_2)=34.1$$
Step 1: State the Hypotheses
Since we are testing whether $Age$ has an effect on $Income$, our null hypothesis is
$$H_0:\beta_2=0$$
and our alternative hypothesis is
$$H_1:\beta_2\neq0$$
So the null says that $Age$ has no effect within our population model, while the alternative says that its coefficient is non-zero.
Step 2: Compare $V$ and $T$
Recall our standardised estimator from the previous page:
$$V=\left(\frac{\hat\beta_2-\color{red}{\beta_2}}{SE(\hat\beta_2)}\right)_{\mid\mathbf{X}=\mathbf{x}}$$
Under our standard regression assumptions, including normality, we know for sure that
$$V\sim t_{n-k-1}$$
Our model contains $k=5$ independent variables, so here
$$V\sim t_{5994}$$
Now consider our test statistic:
$$T=\left(\frac{\hat\beta_2-\color{red}{0}}{SE(\hat\beta_2)}\right)_{\mid\mathbf{X}=\mathbf{x}}$$
If the null hypothesis is true, then
$$\beta_2=0$$
and therefore $V$ and $T$ are exactly the same random variable.
So, under $H_0$,
$$T\sim t_{5994}$$
This $t_{5994}$ distribution may be called our reference distribution for the test.
To emphasise one more time: whether or not $H_0$ is true is precisely the question of whether $T$ has this reference $t_{5994}$ distribution.
Step 3: Calculate the Observed $t$
Once we have collected our particular sample, $T$ takes an observed value $t$.
Using our estimate and standard error,
$$t=\frac{-138.6-0}{34.1}=-4.06$$
So, our observed estimate lies just over four estimated standard deviations below the value of zero claimed by the null hypothesis.
On the slide, this is shown graphically.
Step 4: Is This Plausible Under the Null?
If $H_0$ were true, our observed $t$ would have come from a $t_{5994}$ distribution – which is extremely close to a standard normal distribution.
For a distribution like this, there is only about a 5% chance of getting a value bigger than $1.96$ or less than $-1.96$.
That is, such an occurrence would be a “rare event” at the 5% significance level, our chosen threshold for what counts as sufficiently unusual.
Yet our observed value is far more extreme:
$$t=-4.06$$
If indeed the null were true, and $T\sim t_{5994}$, we would have witnessed an extraordinarily unusual event.
We could put this down to astonishing luck. But the more reasonable explanation is that the story we started with – that $\beta_2=0$ – is false.
Conclusion
Formally, at this point you should say politely that you reject the null hypothesis, $H_0:\beta_2=0$, at the 5% significance level.
What does this actually mean?
It means that the value we observed would be sufficiently unusual if $\beta_2=0$ that the data have convinced us to reject that possibility. We therefore have evidence that $Age$ has an effect on $Income$ within this model.
Of course, our estimate
$$\hat\beta_2=-138.6$$
has suggested all along that this effect is negative, holding the other variables fixed.
But the crucial point is that we did not reject the null merely because $\hat\beta_2$ was different from zero. We rejected it because our observed $t=-4.06$ would be very unusual if $T$ really had the $t_{5994}$ distribution implied by the null hypothesis.
Coming full circle to our initial thoughts at the start of this section, we arrived at $t=-4.06$ by evaluating the coefficient estimate relative to how precise we think our estimator is: that is, by dividing the estimate by its standard error, our estimate of the estimator’s standard deviation.
Background
Understanding Econometrics is completely free to use, and always will be.
If you found the site useful and would like to help me keep adding new material, please consider buying me a coffee! Buy me a coffee ☕