Testing Whether a Coefficient Is Zero
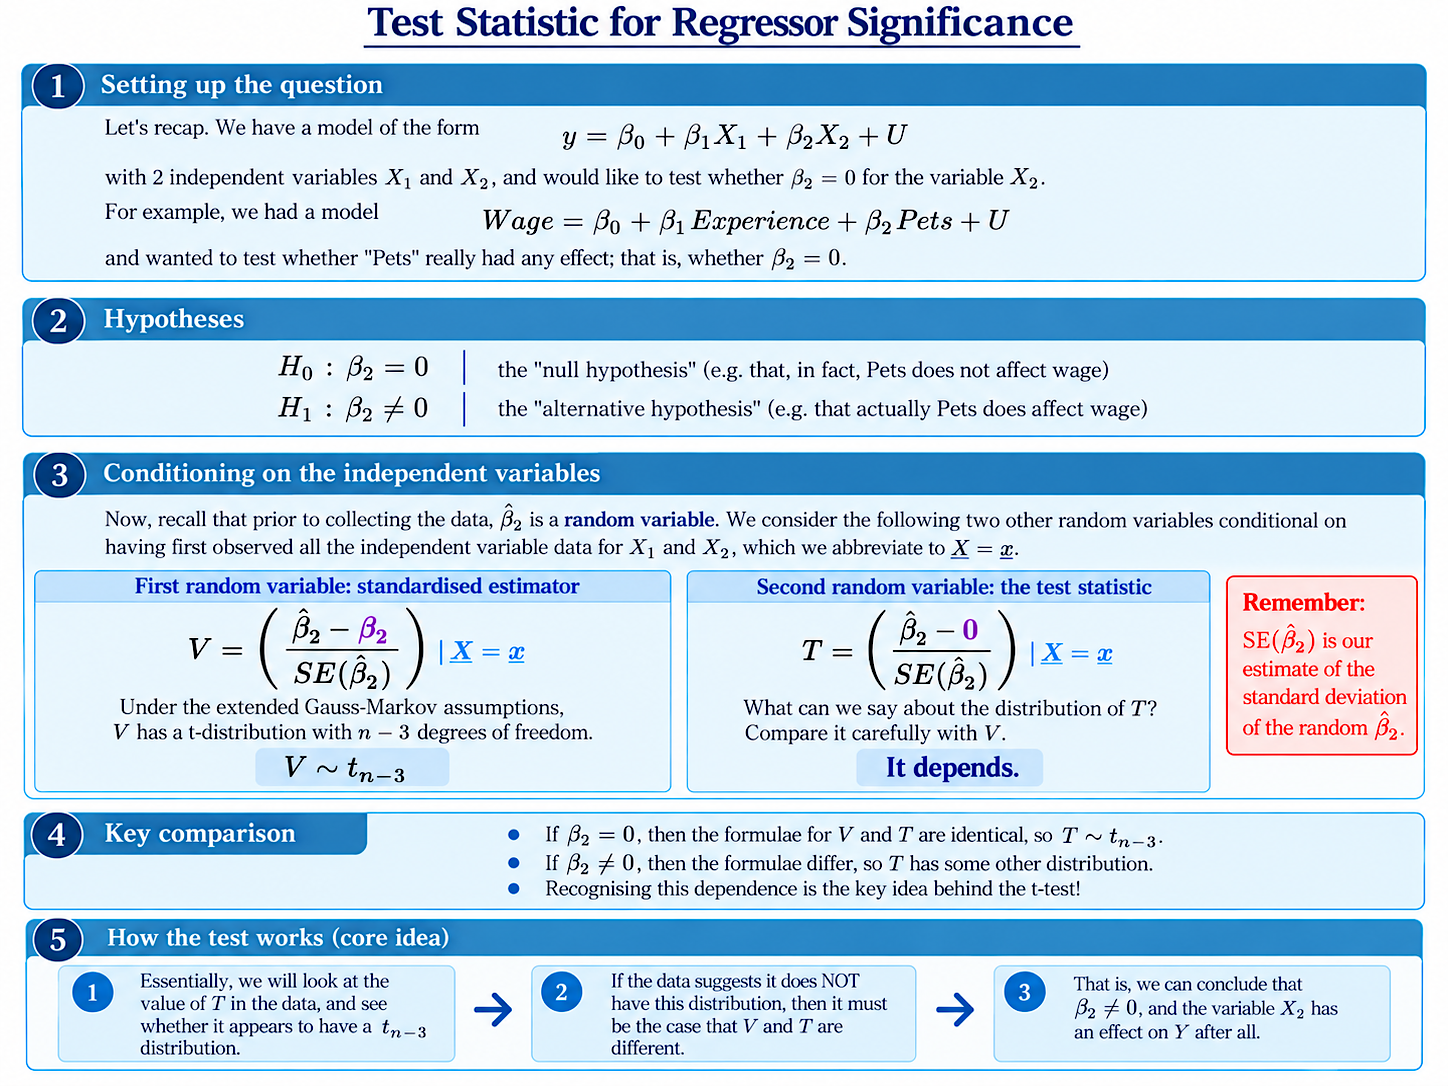
Suppose we have a regression model with two independent variables:
$$Y=\beta_0+\beta_1X_1+\beta_2X_2+U$$
We would like to test whether $X_2$ really has an effect on $Y$.
In terms of the population coefficient, our question is whether
$$\beta_2=0$$
or whether
$$\beta_2\neq0$$
We formalise these two possibilities using hypotheses.
The Null and Alternative Hypotheses
Our null hypothesis is
$$H_0:\beta_2=0$$
while our alternative hypothesis is
$$H_1:\beta_2\neq0$$
The null hypothesis is therefore the claim that $X_2$ has no effect on $Y$ in our population model.
A Standardised Estimator
Recall that $\hat\beta_2$ is a random variable before we collect our data.
Conditional on the observed independent-variable data $\mathbf{X}=\mathbf{x}$, consider the standardised estimator
$$V= \left( \frac{\hat\beta_2-\beta_2}{SE(\hat\beta_2)} \right) _{\mid \mathbf{X}=\mathbf{x}} $$
$V$ is a useful thing to think about because, under our full set of regression assumptions, including normality, $V$ is a “pivot” – a random variable whose distribution is fully known.
More specifically, under these standard assumptions, $V$ always has a $t$-distribution with $n-k-1$ degrees of freedom (for a sample size $n$ and model with $k$ independent variables).
In the example on the slide, then, since the model has two independent variables and an intercept,
$$V\sim t_{n-3}$$
Let’s continue with this example for the rest of the slide; the extension to the general case should be clear.
The Test Statistic
The random variable that is the star of the show with the $t$-test is given by the following formula. We call it the test statistic:
$$T= \left( \frac{\hat\beta_2-\color{red}{0}}{SE(\hat\beta_2)} \right) _{\mid \mathbf{X}=\mathbf{x}} $$
Now, compare this very carefully with $V$:
$$V= \left( \frac{\hat\beta_2-\color{red}{\beta_2}}{SE(\hat\beta_2)} \right) _{\mid \mathbf{X}=\mathbf{x}} $$
Are they the same, or different? Or does it depend? Be as precise as you can!
The Key Comparison
In comparing $V$ and $T$ we should have noticed that they were almost the same, except that in the formula for $T$, the $\beta_2$ has been replaced with a $0$.
So, is $T$ different from $V$? The answer is: it depends.
Recall that we don’t know the value of $\beta_2$. It might be $0$; or on the other hand, it might not be. In fact, whether $\beta_2=0$ or not is exactly the thing we are supposed to be testing. Hmmm – interesting!
More formally, we might say that, if the null hypothesis is true, then $\beta_2=0$ – and in that case, the two formulae become identical:
$$T=V$$
Now, we know for sure that $V$ has a $t$-distribution. So, if indeed the null hypothesis is true, and $V$ and $T$ are therefore exactly the same, it will also be true that
$$T\sim t_{n-3}$$
under the null hypothesis.
Let’s repeat that one more time:
$$H_0 \text{ is true } \ \ \Rightarrow \ \ \beta_2=0 \ \ \Rightarrow \ \ T=V \ \ \Rightarrow \ \ T\sim t_{n-3}$$
On the other hand, if the null is false, and $\beta_2\neq0$, then $T$ and $V$ will be different random variables, and $T$ will no longer have this same $t$-distribution, but some other distribution.
This is the central idea behind the test.
How the Test Works
Once we have collected our data, we calculate the observed value of $T$, usually written as a lower-case $t$.
We then ask:
Does this $t$ look like a value that might plausibly have arisen from a $t_{n-3}$ distribution?
Of course, this is exactly the same question as the following:
Does this $t$ look like a value that might plausibly have arisen from the distribution that $T$ would have if $H_0$ were true?
If our observed $t$ is something that would be very unusual under the $t_{n-3}$ distribution, this suggests that perhaps the whole story is bluff and $H_0$ is false after all.
On the next page, we put this method to work in a full example.
Understanding Econometrics is completely free to use, and always will be.
If you found the site useful and would like to help me keep adding new material, please consider buying me a coffee! Buy me a coffee ☕