Probability vs Likelihood
Probabilities and likelihoods are very closely related. In fact, they can be calculated using exactly the same formula! The difference lies in how we think about them: what we know already, and what we are trying to find.
Suppose we are going to flip a coin five times, where the probability of heads is $p$.
Let $X$ be the number of heads.
Then:
$$X\sim\operatorname{Bin}(5,p).$$
Before performing this experiment, we might ask for the probability of obtaining three heads:
$$\mathbb{P}(X=3)=\binom{5}{3}p^3(1-p)^2=10p^3(1-p)^2.$$
Here we imagine that $p$ is given, and ask about a possible outcome $X$.
This is an example of the Binomial Distribution.
Likelihood turns this point of view around.
After We Have Observed the Data
Suppose we have now actually flipped the coin five times, and indeed obtained three heads.
The outcome is no longer unknown:
$$x=3.$$
Instead, imagine that we do not know $p$. We can ask how plausible different possible values of $p$ are in light of the result we obtained.
For any proposed value of $p$, we calculate what the probability of our observed result would have been if that had been the true probability of heads.
This gives the likelihood function
$$L(p\mid x)=10p^3(1-p)^2,$$
where here $x=3$.
Notice that this is exactly the same formula as before! What has changed is how we use it.
With probability, we treat $p$ as given and consider what might happen.
With likelihood, the data have already been collected. Instead, we hold $x$ fixed and compare different possible values of $p$.
Reading the Likelihood Graph
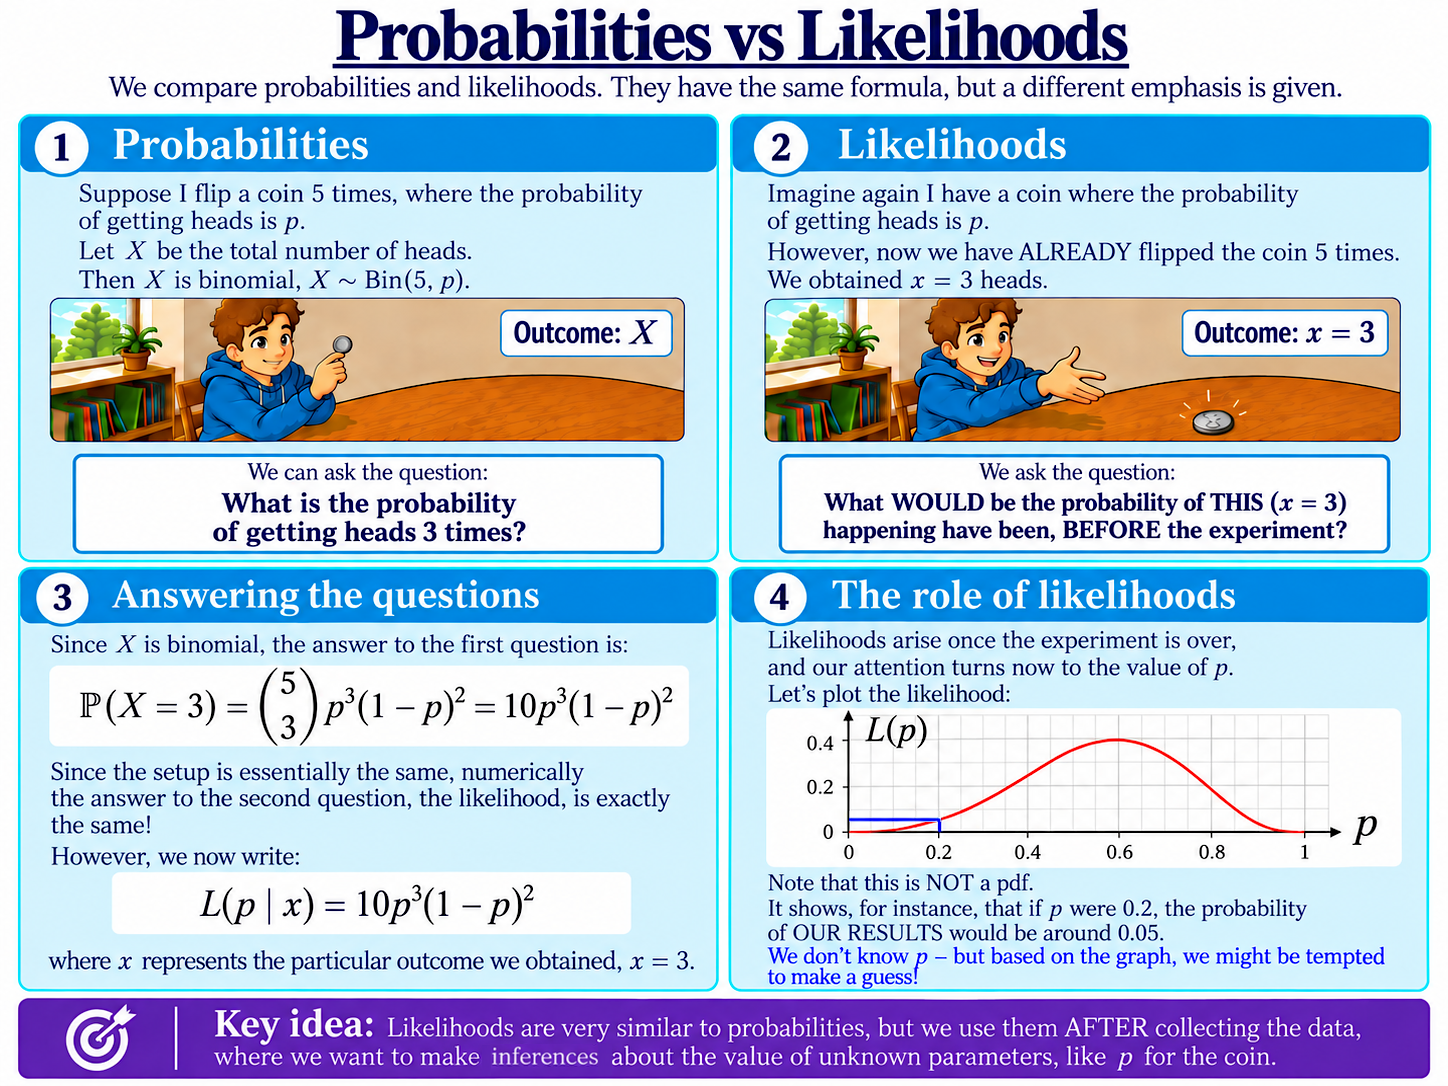
The graph on the slide plots
$$L(p\mid 3)=10p^3(1-p)^2$$
against different values of $p$.
For example, if $p=0.2$, the height of the graph tells us the probability that a coin with this value of $p$ would have produced exactly three heads from five flips (the exact value is $0.0512$).
Different values of $p$ give different likelihoods for the same observed data. Values producing a larger likelihood are, in this sense, more compatible with what we observed.
Importantly, the likelihood function is not a pdf for $p$. We are not assigning probabilities to different possible values of the unknown parameter. In our way of thinking, $p$ is not a random variable, but just a number!
Now, looking at the graph, is there a particular guess of the unknown $p$ that you feel compelled to make?
Background
Understanding Econometrics is completely free to use, and always will be.
If you found the site useful and would like to help me keep adding new material, please consider buying me a coffee! Buy me a coffee ☕