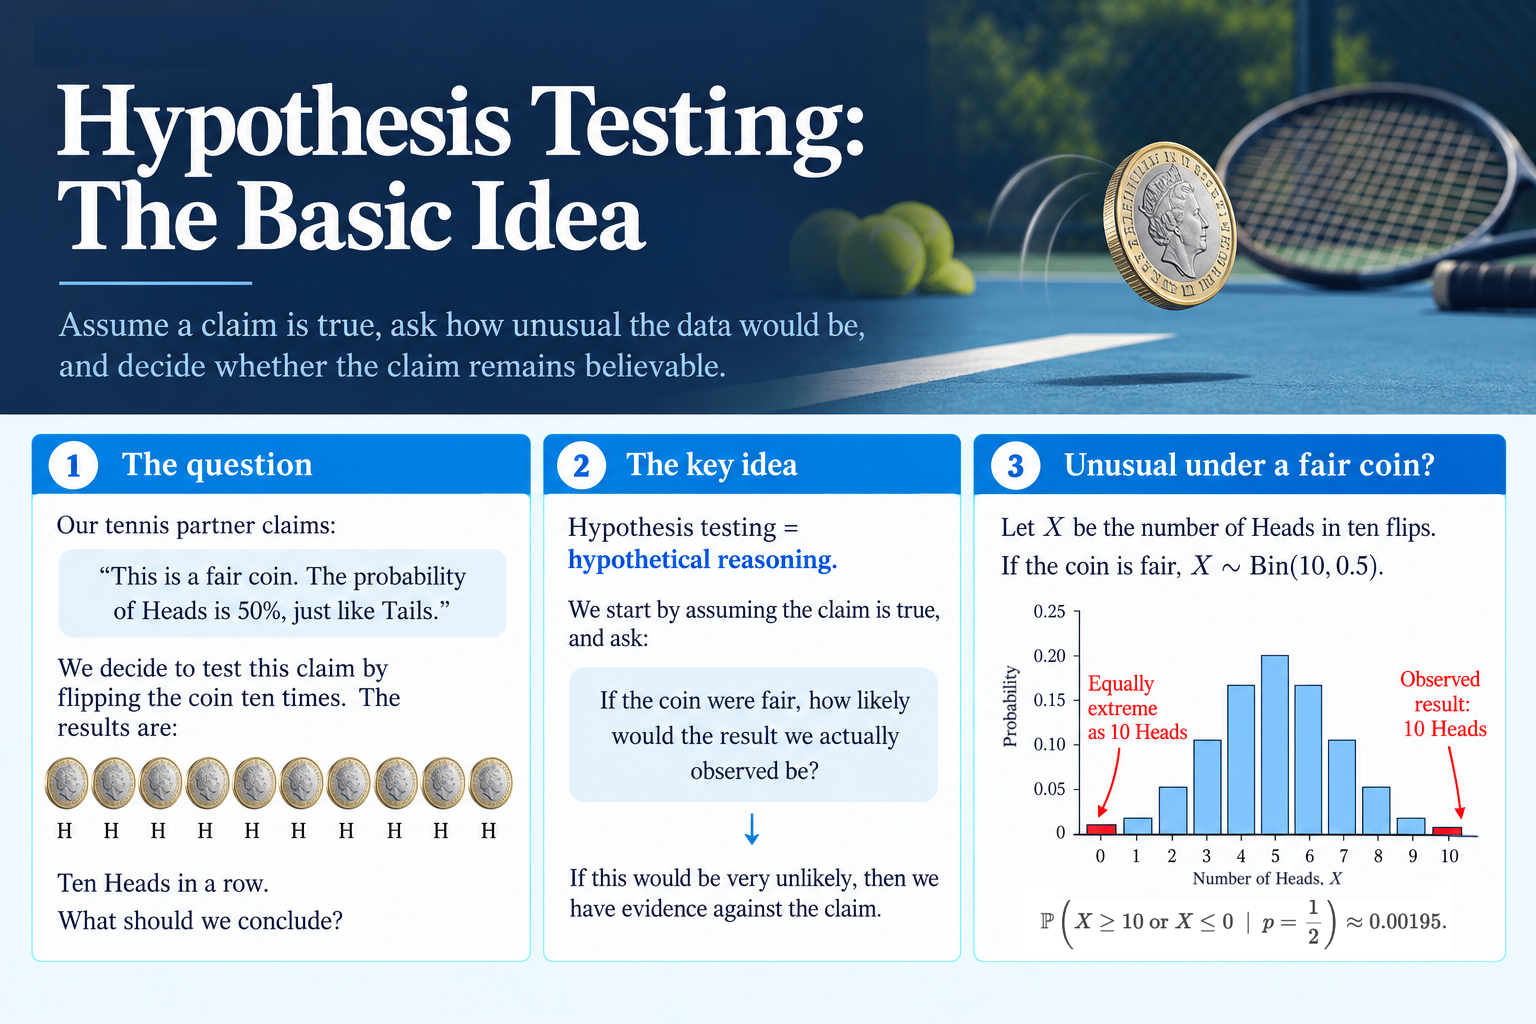
What Is Hypothesis Testing?
Hypothesis testing is one of the most important ideas in statistics — and one of the easiest to learn mechanically without really understanding what is going on.
There are many different hypothesis tests, with different formulae and different probability distributions. But the underlying logic is always much the same.
Rather than memorising a collection of procedures, it is worth getting this logic straight first.
At its heart, hypothesis testing asks a hypothetical question:
If a particular claim were true, how surprising would the data we actually observed be?
If the answer is extremely surprising, that gives us reason to doubt the original claim.
We can see the idea with a simple example.
A Suspicious Coin
Imagine that you regularly play tennis. At the start of each match, your new partner flips a coin to decide who will serve first.
They insist on using the same coin every time, and announce that if it lands Heads, they serve first.
After several matches, you begin to notice something suspicious: they seem to win the toss every single time.
Eventually, you challenge them. They reply:
“This is a fair coin. The probability of Heads is 50%, just like Tails.”
Rather than simply arguing about it, suppose you agree to test their claim.
You flip the coin ten times.
And get:
$$ H,H,H,H,H,H,H,H,H,H. $$
Ten Heads in a row.
What should we conclude?
The Key Hypothetical Argument
The central reasoning is:
If the coin were fair, getting ten Heads in a row would be very unlikely.
But we actually did get ten Heads in a row.
So perhaps the coin is not fair after all.
The first sentence is the crucial one.
We are temporarily imagining that the claim is true. We then ask what the world would look like under that assumption.
So:
hypothesis testing = hypothetical reasoning.
We begin by pretending that the coin really is fair, and then calculate how likely our observed result would be in that hypothetical world.
How Unlikely Is Ten Heads?
Let $p$ denote the probability of Heads.
The claim that the coin is fair says
$$ p=\frac12. $$
If this were true, the probability of ten Heads in a row would be
$$\left(\frac12\right)^{10} =\frac{1}{1024} \approx 0.000977.$$
So, if the coin really were fair, ten Heads in a row would be an extraordinarily unusual result.
This seems to gives us evidence against the claim that $p=\frac12$.
However, there is an important complication.
“Every Particular Sequence Is Unlikely”
Your tennis partner might object:
“Of course ten Heads in a row is unlikely. But every particular sequence of ten coin flips is unlikely.”
And they would be right.
For example,
$$ H,T,H,T,H,T,H,T,H,T $$
also has probability
$$ \left(\frac12\right)^{10} \approx 0.000977 $$
if the coin is fair.
Yet intuitively these two outcomes do not seem equally suspicious.
Why not?
The important thing is not usually the exact sequence of results.
Instead, we ask whether some relevant summary of the data is unusually extreme.
Here, a natural quantity to consider is the number of Heads.
Let
$$ X=\text{number of Heads in ten flips}. $$
If the coin is fair, we would expect around five Heads.
Getting ten Heads is therefore much more extreme than getting five.
Results As Extreme or More Extreme
There is one more subtlety.
We are considering ten Heads as evidence against a fair coin; yet surely we would have taken the same view after obtaining ten Tails too.
So, when considering how extreme the result was, rather than considering only the probability of ten Heads, we should consider outcomes at least as extreme in either direction.
Under the claim $p=\frac12$, this becomes:
$$\mathbb P\left(X\geq 10 \text{ or }X\leq 0 \ \mid \ p=\frac12\right)=\left(\frac12\right)^{10}+\left(\frac12\right)^{10}.$$
Hence
$$ \mathbb P \left( X\geq 10 \text{ or } X\leq 0 \ \mid \ p=\frac12 \right) \approx 0.00195. $$
This is still extremely small.
So even after allowing for equally extreme outcomes in the opposite direction, the result remains very difficult to reconcile with a fair coin.
One-Sided and Two-Sided Tests
Whether we should look in one direction or both directions depends on the question we decided to ask.
Perhaps, before carrying out the experiment, we specifically suspected that the coin was biased towards Heads.
Then we might only be interested in unusually large values of $X$.
Alternatively, we might simply suspect that the coin is not fair, without knowing whether it favours Heads or Tails.
Then unusually small values of $X$ should count as evidence too.
The important point is that the testing procedure should be decided before looking at the data.
This rules out the bad practice of observing the result first and only then inventing a rule that makes that particular result appear suspicious.
The Null Hypothesis
We now introduce the standard terminology.
The claim that we initially assume to be true is called the null hypothesis.
In our example,
$$ H_0:p=\frac12. $$
This is the hypothesis that actually allows us to do the probability calculations above.
We ask:
If $H_0$ were true, how unusual would our observed result be?
The competing claim is called the alternative hypothesis.
For a two-sided test,
$$ H_1:p\neq\frac12. $$
Notice an important asymmetry between these two hypotheses.
We can calculate probabilities under $H_0$, because it gives us the specific value
$$ p=\frac12. $$
But merely knowing that
$$ p\neq\frac12 $$
does not tell us exactly what the probability of Heads is.
The alternative hypothesis therefore does much less direct work in the calculation.
The General Logic of a Hypothesis Test
The same basic reasoning appears again and again in statistics.
- State a null hypothesis.
- Temporarily assume that the null hypothesis is true.
- Work out how a suitable “test statistic” would behave under the assumption that it is true.
- Observe the value of that statistic in the data.
- Ask whether the observed value would be unusually extreme if the null were true and our test statistic behaved as in point 3 in general.
If the observed result would be very unusual under the null hypothesis, we take this as evidence against it.
We then say that we reject the null hypothesis.
If the result is not sufficiently unusual, we do not reject the null hypothesis.
In the latter case, we do not conclude that we have somehow proved the null to be true. Rather, we are only saying that the data would look plausible in a hypothetical world in which the null hypothesis were true.
Key Idea
Hypothesis testing starts by assuming the null hypothesis is true. We then ask whether the data we actually observed would be unusually extreme under that assumption. If they would, we have evidence against the null.
Understanding Econometrics is completely free to use, and always will be.
If you found the site useful and would like to help me keep adding new material, please consider buying me a coffee! Buy me a coffee ☕